Technical Analysis of FLJP 2024-05-10
Overview:
In analyzing the technical indicators for FLJP over the last 5 days, we will delve into the trend, momentum, volatility, and volume indicators to provide a comprehensive outlook on the possible stock price movement. By examining these key aspects, we aim to offer valuable insights and predictions for the upcoming days.
Trend Analysis:
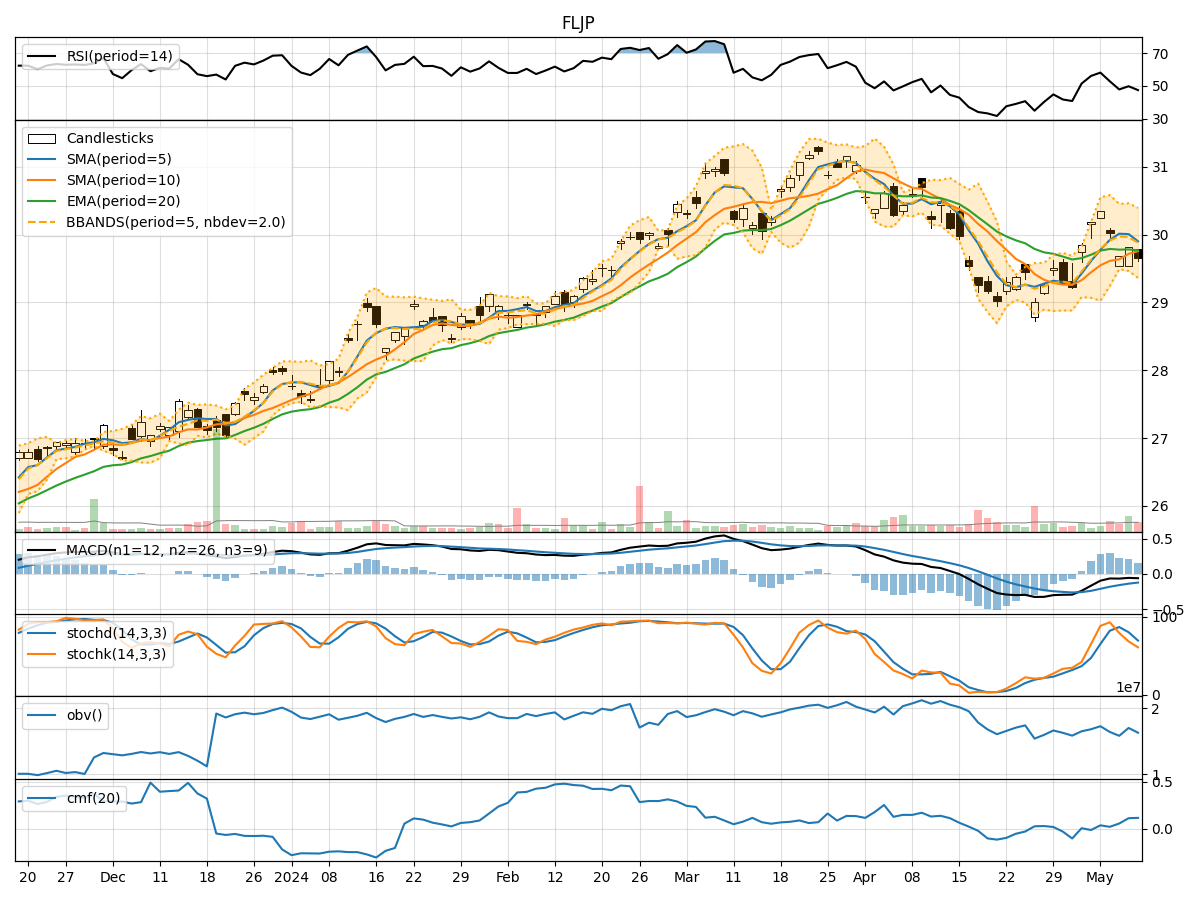
- Moving Averages (MA): The 5-day Moving Average (MA) has been fluctuating around the Simple Moving Average (SMA) and Exponential Moving Average (EMA) values, indicating a lack of clear trend direction.
- MACD: The Moving Average Convergence Divergence (MACD) has been consistently negative, suggesting a bearish momentum in the short term.
- MACD Histogram: The MACD Histogram has been decreasing, indicating a weakening bearish momentum.
Momentum Analysis:
- RSI: The Relative Strength Index (RSI) has been hovering around the mid-range, indicating a neutral momentum with no clear overbought or oversold conditions.
- Stochastic Oscillator: Both %K and %D values have been declining, signaling a bearish momentum.
- Williams %R: The Williams %R is in the oversold territory, suggesting a potential reversal or bounce.
Volatility Analysis:
- Bollinger Bands (BB): The Bollinger Bands have been narrowing, indicating decreasing volatility and a potential period of consolidation.
- Bollinger %B: The %B value has been relatively low, suggesting the stock is trading near the lower band.
Volume Analysis:
- On-Balance Volume (OBV): The OBV has been fluctuating, indicating mixed buying and selling pressure.
- Chaikin Money Flow (CMF): The CMF has been positive, suggesting a net inflow of money into the stock over the past 20 days.
Conclusion:
Based on the analysis of the technical indicators, the stock FLJP is currently exhibiting a bearish bias in the short term. The trend indicators show a lack of clear direction, with a bearish MACD signal. Momentum indicators suggest a bearish sentiment, especially with the Stochastic Oscillator in oversold territory. Volatility is decreasing, indicating a potential consolidation phase. Volume indicators show mixed signals but with a slight positive bias.
Forecast:
Considering the overall technical picture, the next few days for FLJP are likely to see further downside pressure with a possible continuation of the bearish trend. Traders should exercise caution and consider short-term selling opportunities or wait for a clearer trend reversal signal before considering long positions. It is essential to monitor key support levels and any potential catalysts that could impact the stock price movement.