Technical Analysis of FLLA 2024-05-10
Overview:
In analyzing the technical indicators for FLLA over the last 5 days, we will delve into the trend, momentum, volatility, and volume indicators to provide a comprehensive outlook on the possible stock price movement in the coming days. By examining these key aspects, we aim to offer valuable insights and predictions for informed decision-making.
Trend Indicators:
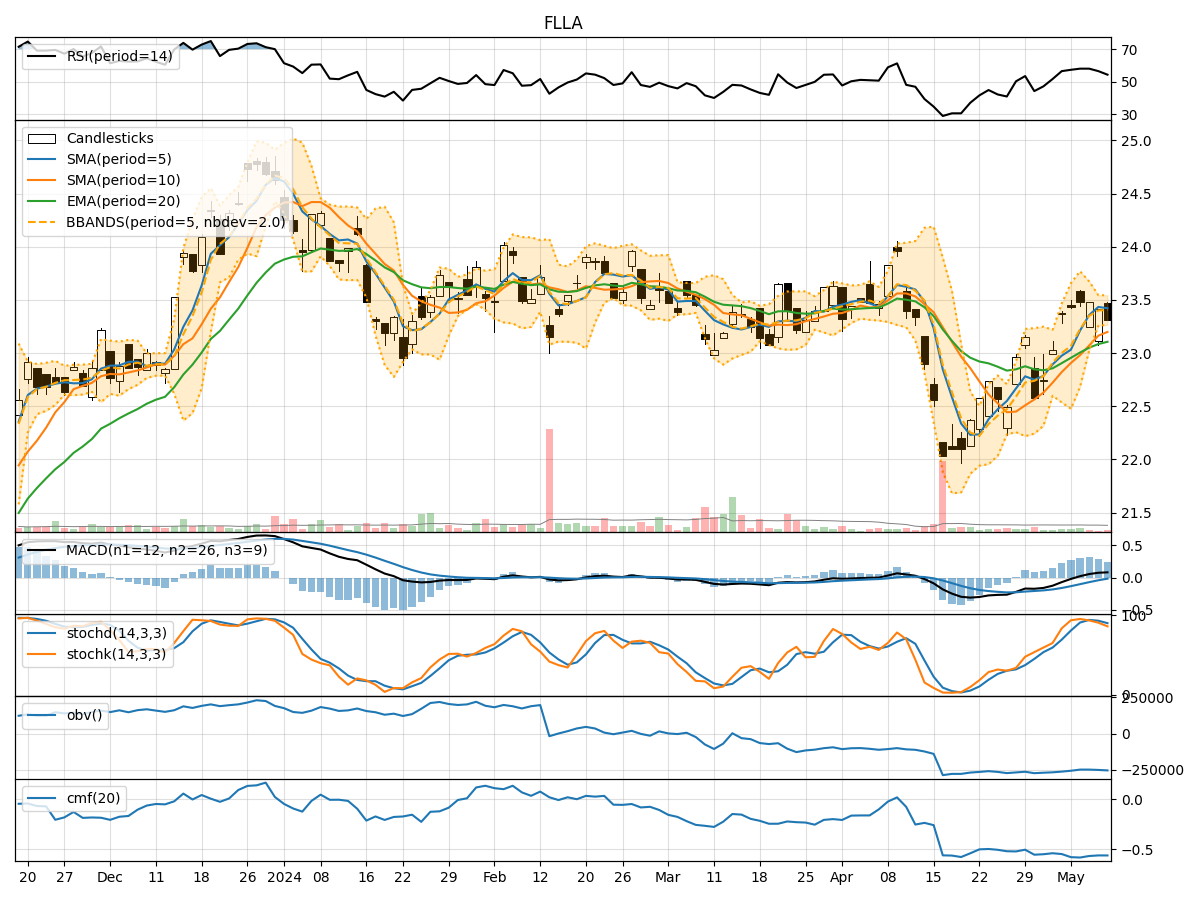
- Moving Averages (MA): The 5-day MA has been consistently above the closing prices, indicating a bullish trend.
- MACD: The MACD line has been above the signal line, suggesting a positive momentum in the stock price.
- RSI: The RSI values have been fluctuating around the neutral zone, indicating a balanced momentum.
Momentum Indicators:
- Stochastic Oscillator: The stochastic indicators have been gradually decreasing, signaling a potential bearish momentum.
- Williams %R (WillR): The WillR values have been in the oversold territory, indicating a possible reversal in the stock price.
Volatility Indicators:
- Bollinger Bands (BB): The stock price has been trading within the Bollinger Bands, suggesting a period of consolidation.
- Average True Range (ATR): The ATR values have been relatively stable, indicating consistent volatility levels.
Volume Indicators:
- On-Balance Volume (OBV): The OBV values have been declining, indicating a potential distribution phase.
- Chaikin Money Flow (CMF): The CMF values have been negative, suggesting a bearish sentiment in the stock.
Key Observations:
- The trend indicators point towards a bullish sentiment in the short term.
- Momentum indicators show a potential shift towards a bearish momentum.
- Volatility indicators suggest a period of consolidation.
- Volume indicators indicate a distribution phase in the stock.
Conclusion:
Based on the analysis of the technical indicators, the next few days' possible stock price movement for FLLA is likely to experience a short-term consolidation phase with a potential bearish bias. Traders should closely monitor the stochastic indicators for a possible reversal signal and consider the decreasing OBV values as a cautionary sign. It is advisable to exercise caution and wait for clearer signals before making significant trading decisions.