Technical Analysis of FLMX 2024-05-10
Overview:
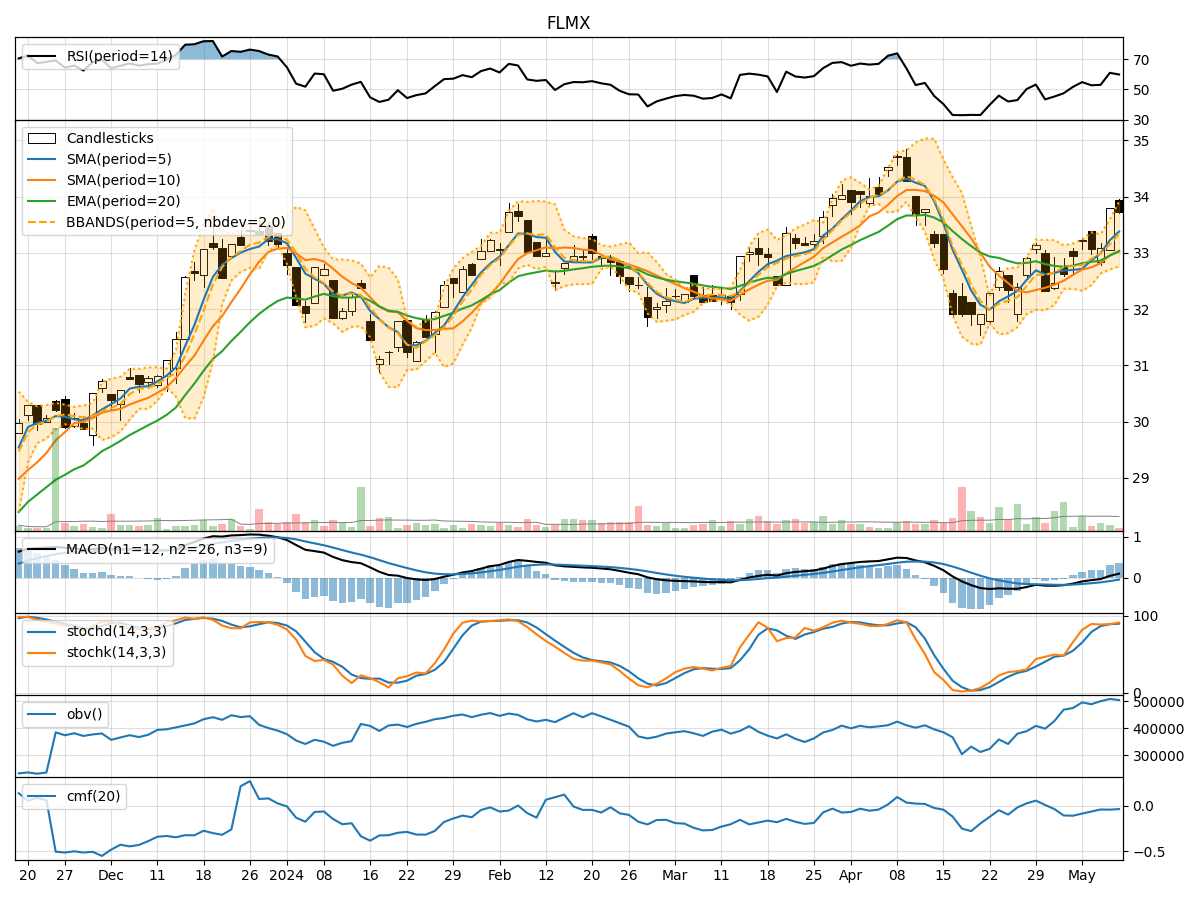
In analyzing the technical indicators for FLMX over the last 5 days, we will delve into the trend, momentum, volatility, and volume indicators to provide a comprehensive outlook on the possible stock price movement in the coming days. By examining these key indicators, we aim to offer valuable insights and predictions for potential investors.
Trend Analysis:
- Moving Averages (MA): The 5-day Moving Average (MA) has been consistently above the Simple Moving Average (SMA) and Exponential Moving Average (EMA), indicating a bullish trend.
- MACD: The MACD line has been positive, with the MACD Histogram showing an increasing trend, suggesting bullish momentum.
Momentum Analysis:
- RSI: The Relative Strength Index (RSI) has been fluctuating around the neutral zone, indicating a lack of strong momentum in either direction.
- Stochastic Oscillator: Both %K and %D have been in the overbought territory, signaling a potential reversal or consolidation.
Volatility Analysis:
- Bollinger Bands (BB): The stock price has been trading within the Bollinger Bands, with the bands narrowing, suggesting a period of low volatility.
Volume Analysis:
- On-Balance Volume (OBV): The OBV has shown a slight increase over the last 5 days, indicating some accumulation by investors.
- Chaikin Money Flow (CMF): The CMF has been negative, suggesting a slight outflow of money from the stock.
Key Observations:
- The trend indicators point towards a bullish sentiment in the short term.
- Momentum indicators show a lack of strong momentum, potentially leading to a period of consolidation.
- Volatility has been decreasing, indicating a possible period of price stability.
- Volume indicators suggest some accumulation but with a slight outflow of money.
Conclusion:
Based on the analysis of the technical indicators, the stock price of FLMX is likely to experience sideways movement or consolidation in the coming days. The bullish trend indicated by moving averages and MACD may be offset by the lack of strong momentum and decreasing volatility. Investors should closely monitor key support and resistance levels for potential breakout opportunities.