Technical Analysis of FLN 2024-05-10
Overview:
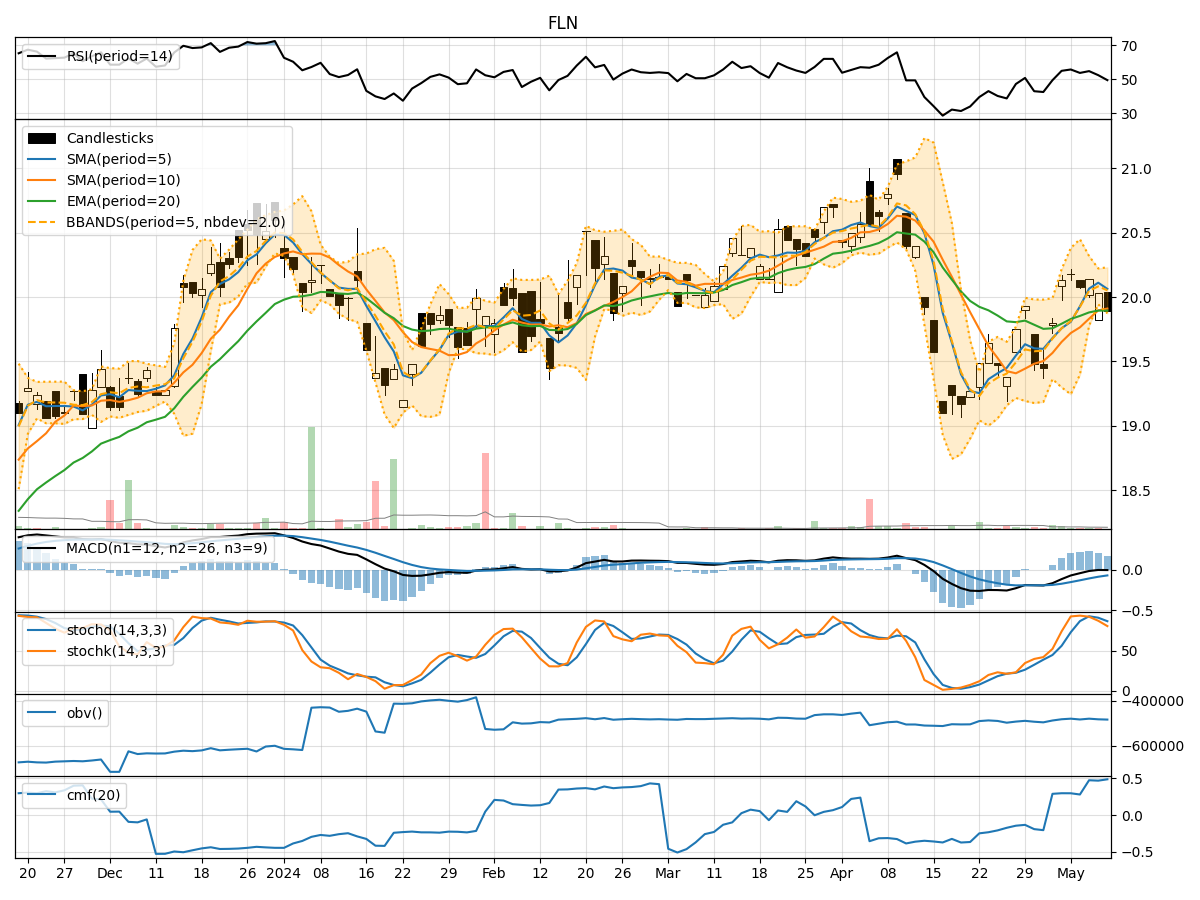
In analyzing the technical indicators for FLN over the last 5 days, we will delve into the trend, momentum, volatility, and volume indicators to provide a comprehensive outlook on the possible stock price movement in the coming days. By examining these key indicators, we aim to offer valuable insights and predictions for potential investors.
Trend Analysis:
- Moving Averages (MA): The 5-day Moving Average (MA) has been consistently above the Simple Moving Average (SMA) and Exponential Moving Average (EMA), indicating a short-term bullish trend.
- MACD: The MACD line has been below the signal line, suggesting a bearish trend. However, the MACD Histogram has been gradually increasing, indicating a potential reversal.
Momentum Analysis:
- RSI: The Relative Strength Index (RSI) has been decreasing, moving towards the oversold territory, signaling a potential reversal or consolidation.
- Stochastic Oscillator: Both %K and %D have been declining, indicating a bearish momentum. The stock is currently oversold based on the Stochastic indicators.
Volatility Analysis:
- Bollinger Bands (BB): The stock price has been trading within the Bollinger Bands, with the bands narrowing, suggesting reduced volatility and a possible consolidation phase.
Volume Analysis:
- On-Balance Volume (OBV): The OBV has been fluctuating, indicating indecision among investors regarding the stock.
- Chaikin Money Flow (CMF): The CMF has been positive, suggesting buying pressure in the stock.
Key Observations:
- The trend indicators show a mixed signal with the moving averages indicating a bullish trend while the MACD suggests a bearish trend.
- Momentum indicators point towards a bearish sentiment with RSI moving towards oversold levels and Stochastic indicators signaling oversold conditions.
- Volatility indicators indicate a potential consolidation phase with reduced price fluctuations.
- Volume indicators reflect indecision among investors, with OBV fluctuating and CMF showing buying pressure.
Conclusion:
Based on the analysis of the technical indicators, the stock is likely to experience further downward movement in the coming days. The bearish momentum indicated by the RSI and Stochastic oscillators, coupled with the mixed signals from the trend indicators, suggests a potential continuation of the current downtrend. Investors should exercise caution and consider waiting for more definitive signals before making any trading decisions.