Technical Analysis of FLOW 2024-05-10
Overview:
In analyzing the technical indicators for FLOW stock over the last 5 days, we will delve into the trend, momentum, volatility, and volume indicators to provide a comprehensive outlook on the possible future stock price movement. By examining these key indicators, we aim to offer valuable insights and predictions for the upcoming trading days.
Trend Analysis:
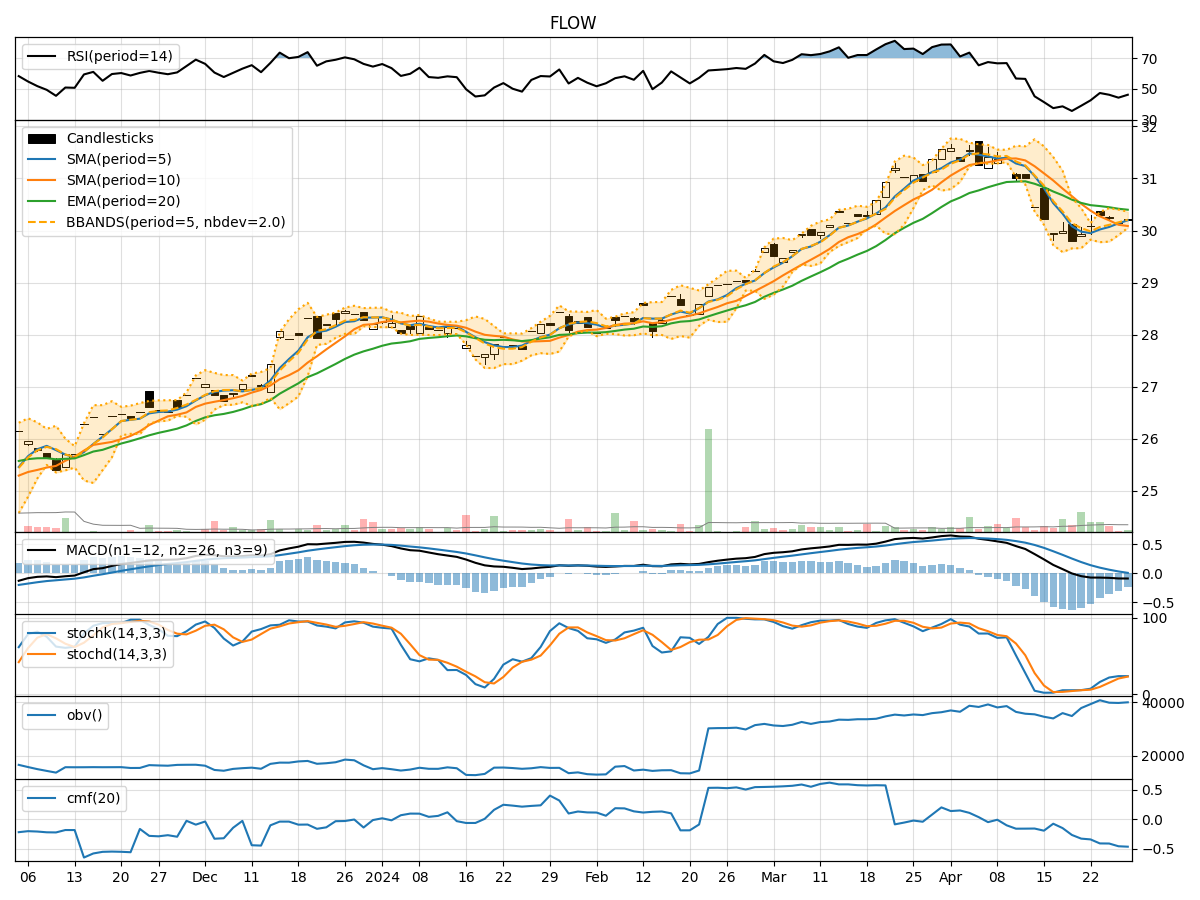
- Moving Averages (MA): The 5-day Moving Average (MA) has been consistently above the Simple Moving Average (SMA) and Exponential Moving Average (EMA) over the past 5 days, indicating a short-term uptrend.
- MACD: The Moving Average Convergence Divergence (MACD) has been negative but showing signs of convergence towards the signal line, suggesting a potential reversal in the trend.
- MACD Histogram: The MACD Histogram has been gradually moving towards the zero line, indicating a possible shift in momentum.
Momentum Analysis:
- RSI: The Relative Strength Index (RSI) has been fluctuating within the neutral zone, indicating indecision among traders.
- Stochastic Oscillator: Both %K and %D lines of the Stochastic Oscillator have been rising, signaling increasing buying pressure.
- Williams %R: The Williams %R is hovering near oversold territory, suggesting a potential buying opportunity.
Volatility Analysis:
- Bollinger Bands (BB): The Bollinger Bands have been narrowing, indicating decreasing volatility in the stock price.
- Bollinger %B: The %B indicator has been fluctuating within a tight range, reflecting a period of consolidation.
- Average True Range (ATR): The ATR has been decreasing, further confirming the reduction in volatility.
Volume Analysis:
- On-Balance Volume (OBV): The OBV indicator has been relatively flat, suggesting a balance between buying and selling pressure.
- Chaikin Money Flow (CMF): The CMF has been negative, indicating outflows from the stock over the past 20 days.
Conclusion:
Based on the analysis of the technical indicators, the next few days for FLOW stock are likely to see sideways movement with a slight bullish bias. The convergence of the MACD lines, rising Stochastic Oscillator, and potential buying opportunity indicated by Williams %R suggest a possible uptick in prices. However, the neutral RSI, flat OBV, and negative CMF signal a lack of strong conviction among market participants. Therefore, while there may be some upward momentum, it is expected to be limited, and the stock is likely to consolidate in the near term. Traders should exercise caution and closely monitor key support and resistance levels for potential trading opportunities.