Technical Analysis of FLQS 2024-05-10
Overview:
In analyzing the technical indicators for FLQS over the last 5 days, we will delve into the trend, momentum, volatility, and volume indicators to provide a comprehensive outlook on the possible stock price movement in the coming days. By examining these key aspects, we aim to offer valuable insights and predictions to guide investment decisions.
Trend Analysis:
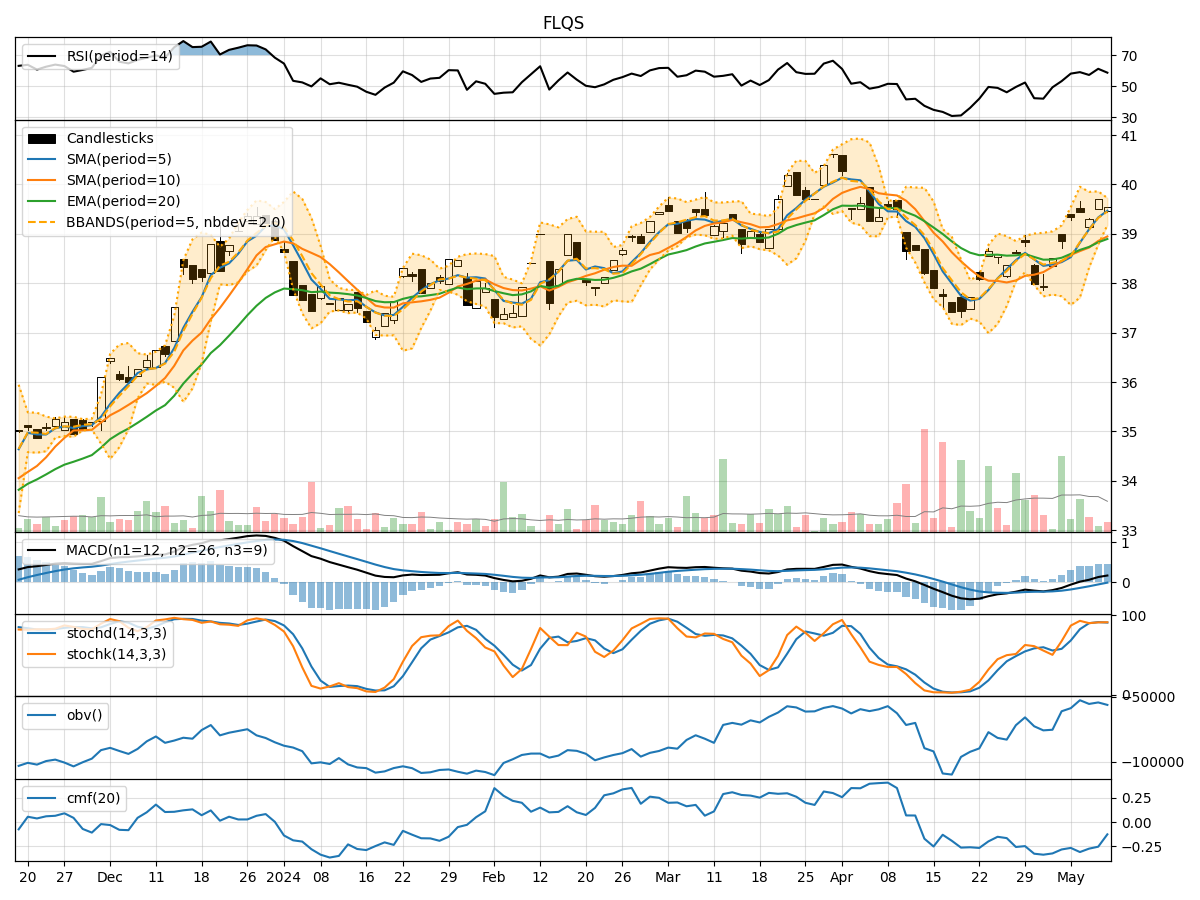
- Moving Averages (MA): The 5-day Moving Average (MA) has been consistently above the Simple Moving Average (SMA) and Exponential Moving Average (EMA), indicating a bullish trend.
- MACD: The MACD line has been consistently above the signal line, with both lines showing an upward trend, suggesting bullish momentum.
- MACD Histogram: The MACD Histogram has been increasing over the past few days, indicating strengthening bullish momentum.
Momentum Analysis:
- RSI: The Relative Strength Index (RSI) has been fluctuating around the 60-70 range, indicating a neutral momentum.
- Stochastic Oscillator: Both %K and %D lines of the Stochastic Oscillator have been in the overbought zone, suggesting a potential reversal or consolidation.
- Williams %R: The Williams %R has been hovering around the oversold territory, indicating a potential buying opportunity.
Volatility Analysis:
- Bollinger Bands: The stock price has been trading within the Bollinger Bands, with the bands narrowing, suggesting a period of low volatility.
- Bollinger %B: The %B indicator has been fluctuating around the middle range, indicating a balanced market sentiment.
Volume Analysis:
- On-Balance Volume (OBV): The OBV has been relatively stable, indicating a neutral volume flow.
- Chaikin Money Flow (CMF): The CMF has been negative, suggesting a slight distribution phase in the stock.
Key Observations and Opinions:
- Trend: The trend indicators point towards a strong bullish sentiment in the stock.
- Momentum: The momentum indicators show a mixed signal, with potential signs of a reversal or consolidation.
- Volatility: The volatility indicators suggest a period of low volatility and potential consolidation.
- Volume: The volume indicators indicate a neutral volume flow with a slight distribution phase.
Conclusion:
Based on the analysis of the technical indicators, the next few days' possible stock price movement for FLQS is likely to be sideways with a slight bullish bias. Traders should monitor the momentum indicators closely for any signs of a reversal or continuation of the current trend. Additionally, keeping an eye on key support and resistance levels identified through the trend and volatility indicators will be crucial in making informed trading decisions.