Technical Analysis of FLRN 2024-05-10
Overview:
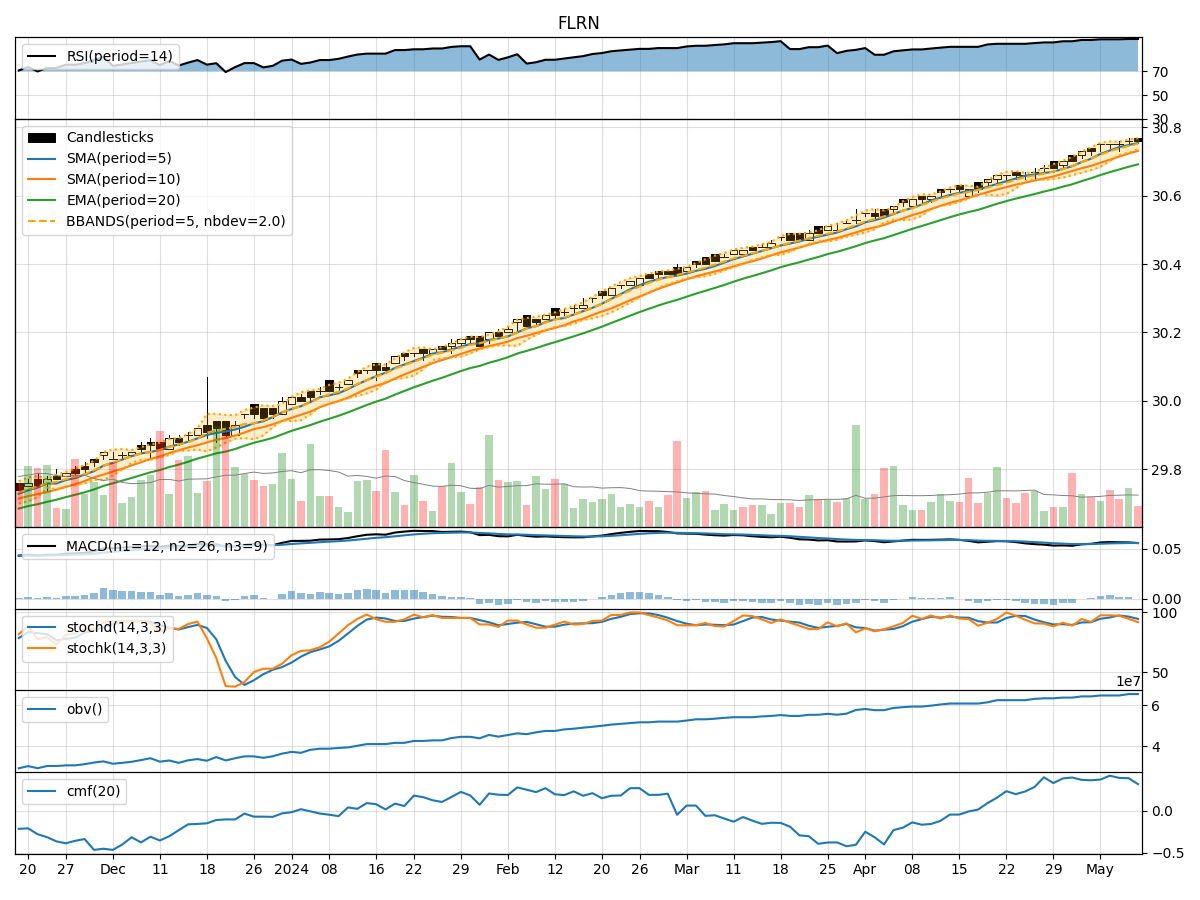
In analyzing the technical indicators for FLRN over the last 5 days, we will delve into the trend, momentum, volatility, and volume indicators to provide a comprehensive outlook on the possible stock price movement in the coming days.
Trend Analysis:
- Moving Averages (MA): The 5-day Moving Average (MA) has been consistently above the Simple Moving Average (SMA) and Exponential Moving Average (EMA), indicating a bullish trend.
- MACD: The MACD line has been positive, with the MACD Histogram mostly above the signal line, suggesting bullish momentum.
Momentum Analysis:
- RSI: The Relative Strength Index (RSI) has been in the overbought territory, indicating a strong bullish momentum.
- Stochastic Oscillator: Both %K and %D have been relatively high, signaling an overbought condition.
- Williams %R: The Williams %R has been consistently in the oversold region, further confirming the strong bullish sentiment.
Volatility Analysis:
- Bollinger Bands (BB): The stock price has mostly stayed within the Bollinger Bands, with the bands narrowing, suggesting a decrease in volatility.
Volume Analysis:
- On-Balance Volume (OBV): The OBV has been relatively stable, indicating consistent buying pressure.
- Chaikin Money Flow (CMF): The CMF has shown positive values, reflecting buying pressure in the stock.
Key Observations:
- The trend indicators suggest a strong bullish sentiment, supported by the positive MACD and moving averages.
- Momentum indicators indicate an overbought condition, which may lead to a potential pullback or consolidation.
- Volatility has been decreasing, indicating a possible period of consolidation or sideways movement.
- Volume indicators show consistent buying pressure, supporting the bullish outlook.
Conclusion:
Based on the technical analysis of trend, momentum, volatility, and volume indicators, the stock is likely to experience a short-term pullback or consolidation due to the overbought conditions highlighted by the momentum indicators. However, the overall trend remains bullish, supported by the positive trend indicators and volume accumulation. Traders should be cautious of a potential correction in the near term before considering further long positions.