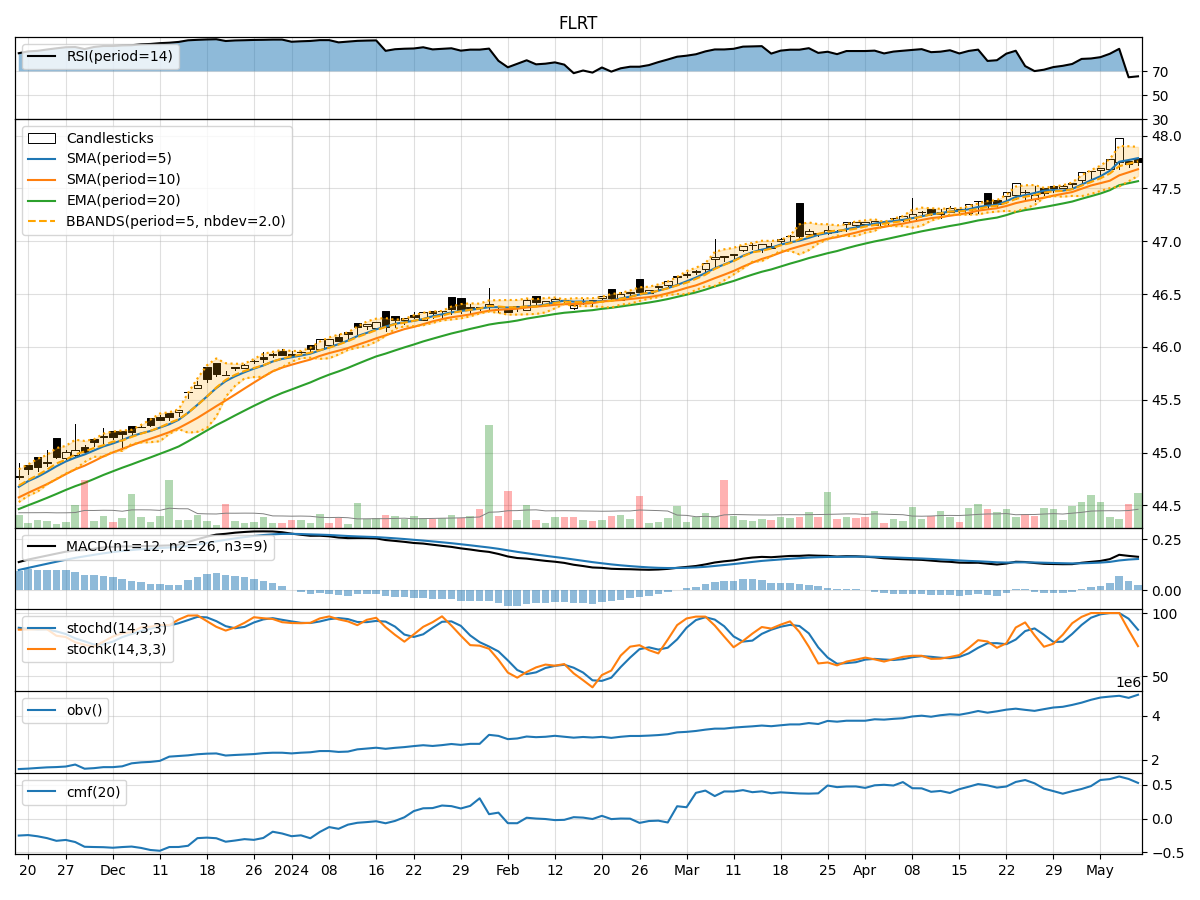
Technical Analysis of FLRT 2024-05-10
Overview:
In analyzing the technical indicators for FLRT over the last 5 days, we will delve into the trend, momentum, volatility, and volume indicators to provide a comprehensive outlook on the possible stock price movement in the coming days.
Trend Indicators:
- Moving Averages (MA): The 5-day MA has been consistently above the closing price, indicating a short-term uptrend.
- MACD: The MACD line has been above the signal line, suggesting bullish momentum.
- EMA: The exponential moving average has been trending upwards, supporting the bullish sentiment.
Momentum Indicators:
- RSI: The Relative Strength Index has been in overbought territory, signaling a strong bullish momentum.
- Stochastic Oscillator: Both %K and %D have been high, indicating an overbought condition.
- Williams %R: The indicator has been in oversold territory, suggesting a potential reversal.
Volatility Indicators:
- Bollinger Bands: The price has been trading within the bands, indicating normal volatility.
- Bollinger %B: The %B has been fluctuating around the midline, reflecting a balanced market sentiment.
Volume Indicators:
- On-Balance Volume (OBV): The OBV has been increasing, showing accumulation by investors.
- Chaikin Money Flow (CMF): The CMF has been positive, indicating buying pressure in the stock.
Key Observations:
- The trend indicators suggest a bullish sentiment with moving averages and MACD supporting an upward trend.
- Momentum indicators show conflicting signals with RSI in overbought territory and Williams %R in oversold territory.
- Volatility indicators indicate normal price fluctuations within the Bollinger Bands.
- Volume indicators reflect positive accumulation and buying pressure in the stock.
Conclusion:
Based on the analysis of technical indicators, the stock is likely to continue its upward trend in the next few days. The bullish trend supported by moving averages and MACD, along with positive volume indicators, outweigh the conflicting signals from momentum indicators. Traders should consider buying opportunities on pullbacks for potential gains.