Technical Analysis of FLSA 2024-05-10
Overview:
In analyzing the technical indicators for FLSA stock over the last 5 days, we will delve into the trends, momentum, volatility, and volume aspects to provide a comprehensive outlook on the possible stock price movement in the coming days. By examining key indicators such as moving averages, MACD, RSI, Bollinger Bands, and OBV, we aim to offer valuable insights and predictions for potential price action.
Trend Analysis:
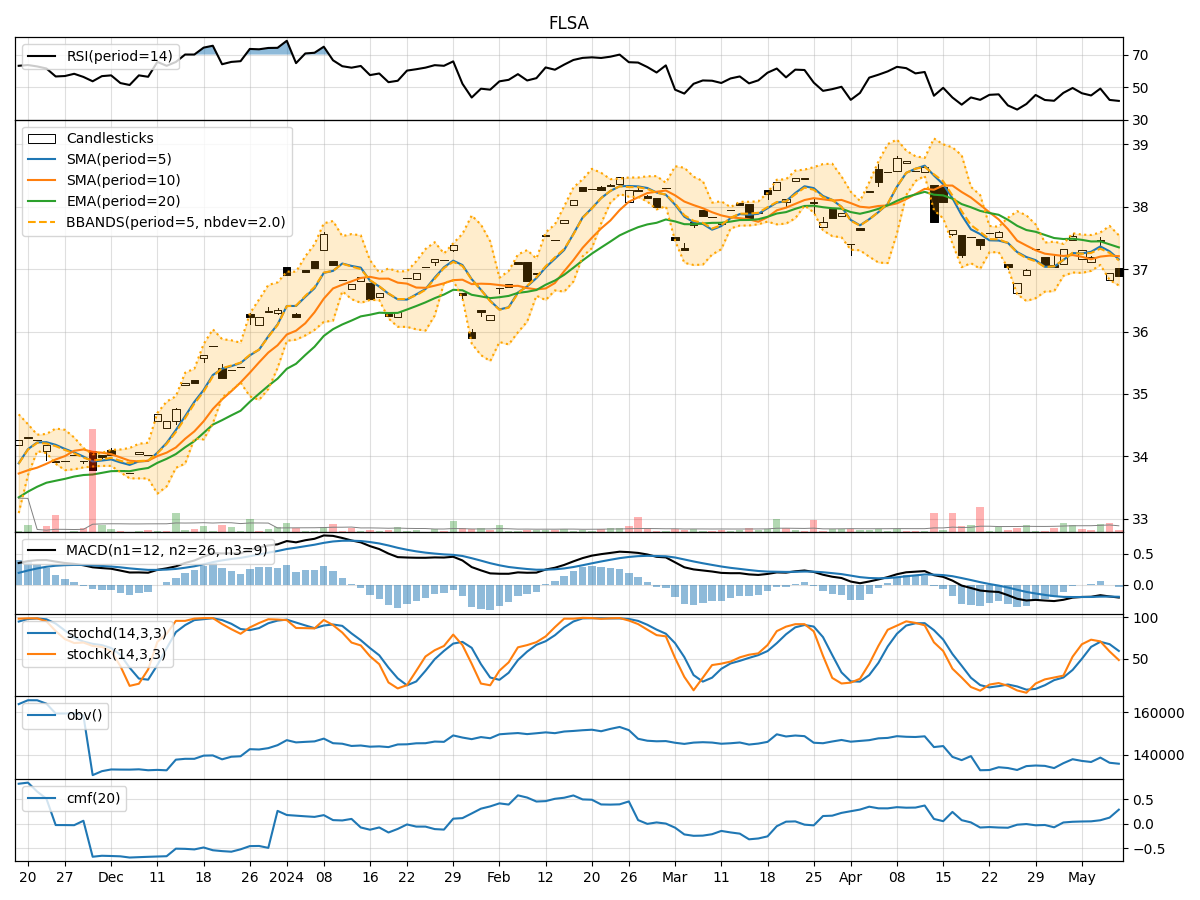
- Moving Averages (MA): The 5-day moving average has been fluctuating around the closing prices, indicating short-term price trends.
- MACD: The MACD line has been consistently below the signal line, suggesting a bearish momentum in the stock.
- EMA: The exponential moving average has been slightly declining, reflecting a weakening trend.
Momentum Analysis:
- RSI: The Relative Strength Index has been hovering around the mid-level, indicating a neutral momentum in the stock.
- Stochastic Oscillator: Both %K and %D have been declining, signaling a potential bearish momentum.
- Williams %R: The Williams %R is in oversold territory, suggesting a possible reversal in the short term.
Volatility Analysis:
- Bollinger Bands: The stock price has been trading within the bands, indicating a period of consolidation and potential breakout.
- Bollinger %B: The %B indicator is relatively neutral, suggesting a balanced volatility outlook.
Volume Analysis:
- On-Balance Volume (OBV): The OBV has been decreasing, indicating selling pressure in the stock.
- Chaikin Money Flow (CMF): The CMF has been positive, suggesting accumulation in the stock over the past 20 days.
Conclusion:
Based on the analysis of the technical indicators, the stock of FLSA is currently exhibiting a mixed outlook. The trend indicators show a slightly bearish sentiment, with the MACD signaling a potential downtrend. Momentum indicators suggest a neutral to bearish momentum, while volatility remains relatively stable with a hint of consolidation. The volume indicators point towards selling pressure, although the CMF indicates some accumulation.
Overall Assessment:
- Trend: Slightly Bearish
- Momentum: Neutral to Bearish
- Volatility: Consolidation
- Volume: Selling Pressure
Forecast:
Considering the current technical landscape, the next few days for FLSA stock may see a continuation of the bearish trend with potential downside movement. Traders should exercise caution and closely monitor key support levels for any signs of a reversal. It is advisable to wait for more definitive signals before considering any long positions.
Key Recommendation:
Short-term traders: Consider shorting or staying on the sidelines until a clearer trend emerges. Long-term investors: Monitor the stock closely for potential entry points at lower price levels.
By integrating these insights and recommendations, investors can make more informed decisions aligned with the prevailing market dynamics and technical indicators.