Technical Analysis of FLSP 2024-05-10
Overview:
In analyzing the technical indicators for FLSP over the last 5 days, we will delve into the trend, momentum, volatility, and volume indicators to provide a comprehensive outlook on the possible stock price movement in the coming days. By examining these key indicators, we aim to offer valuable insights and recommendations for potential investors.
Trend Analysis:
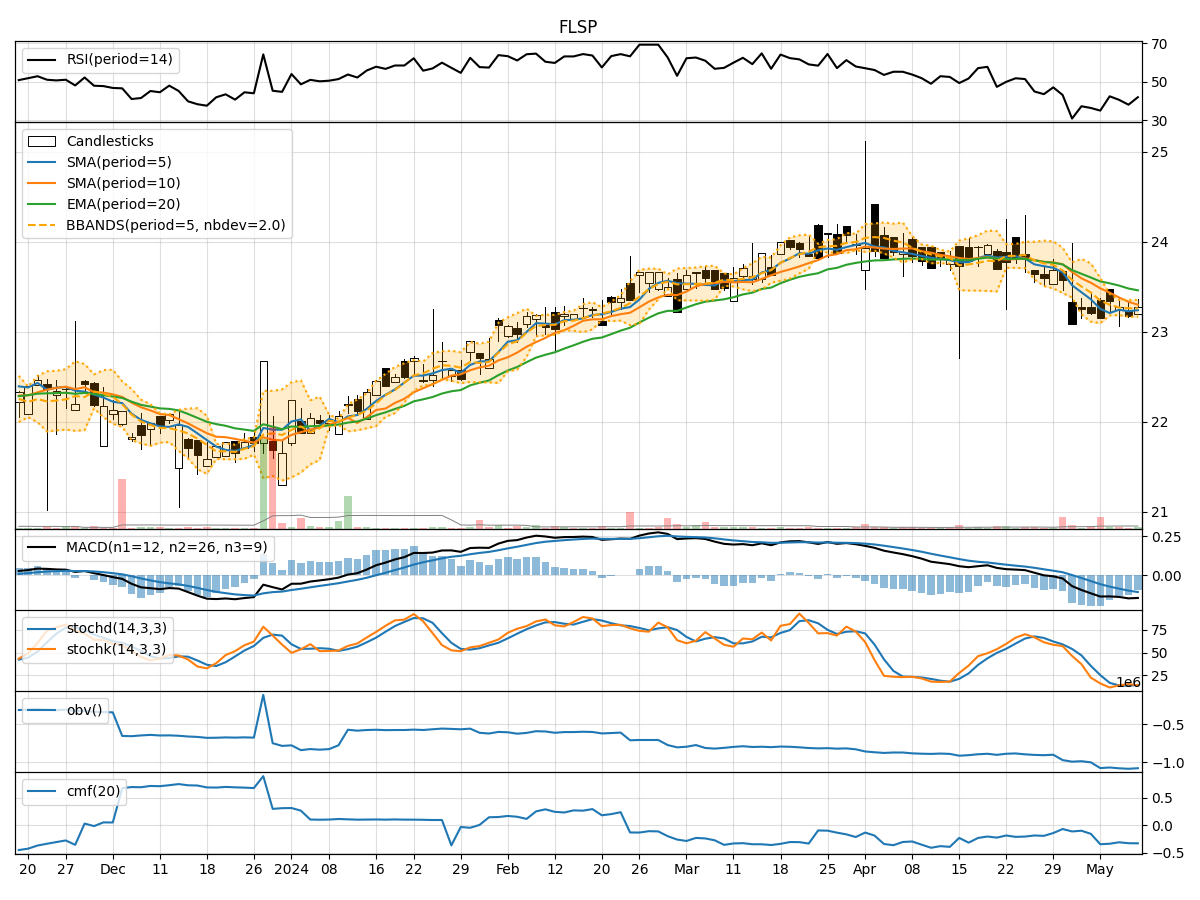
- Moving Averages (MA): The 5-day Moving Average (MA) has been fluctuating around the closing prices, indicating a lack of clear trend direction.
- MACD: The Moving Average Convergence Divergence (MACD) has been consistently negative, suggesting a bearish momentum in the short term.
- EMA: The Exponential Moving Average (EMA) has been declining, further supporting the bearish sentiment in the stock.
Momentum Analysis:
- RSI: The Relative Strength Index (RSI) has been hovering around the oversold territory, indicating a potential reversal or consolidation phase.
- Stochastic Oscillator: Both %K and %D have been relatively low, signaling a potential oversold condition.
- Williams %R: The Williams %R is also in the oversold region, supporting the possibility of a reversal in the stock price.
Volatility Analysis:
- Bollinger Bands: The Bollinger Bands have been narrowing, suggesting decreasing volatility in the stock.
- Bollinger %B: The %B indicator has been fluctuating around the midline, indicating a lack of clear trend direction.
Volume Analysis:
- On-Balance Volume (OBV): The OBV has been consistently negative, reflecting selling pressure in the stock.
- Chaikin Money Flow (CMF): The CMF has been in the negative territory, indicating a lack of buying interest in the stock.
Key Observations:
- The trend indicators point towards a bearish sentiment in the stock, with the MACD and EMA showing consistent downward trends.
- Momentum indicators suggest a potential reversal or consolidation phase, as the RSI, Stochastic Oscillator, and Williams %R indicate oversold conditions.
- Volatility indicators highlight decreasing volatility, which could lead to a period of consolidation or a potential breakout.
- Volume indicators reflect selling pressure and a lack of significant buying interest in the stock.
Conclusion:
Based on the analysis of the technical indicators, the outlook for FLSP in the next few days is bearish. The trend indicators, momentum oscillators, and volume indicators all point towards a continuation of the current downward trend or a period of consolidation. Traders and investors should exercise caution and consider waiting for clearer signals before making any buying decisions. It is advisable to monitor the price action closely for any potential reversal patterns or significant shifts in market sentiment.