Technical Analysis of FLSW 2024-05-10
Overview:
In analyzing the technical indicators for FLSW over the last 5 days, we will delve into the trend, momentum, volatility, and volume indicators to provide a comprehensive outlook on the possible stock price movement. By examining these key aspects, we aim to offer valuable insights and predictions for the upcoming days.
Trend Indicators:
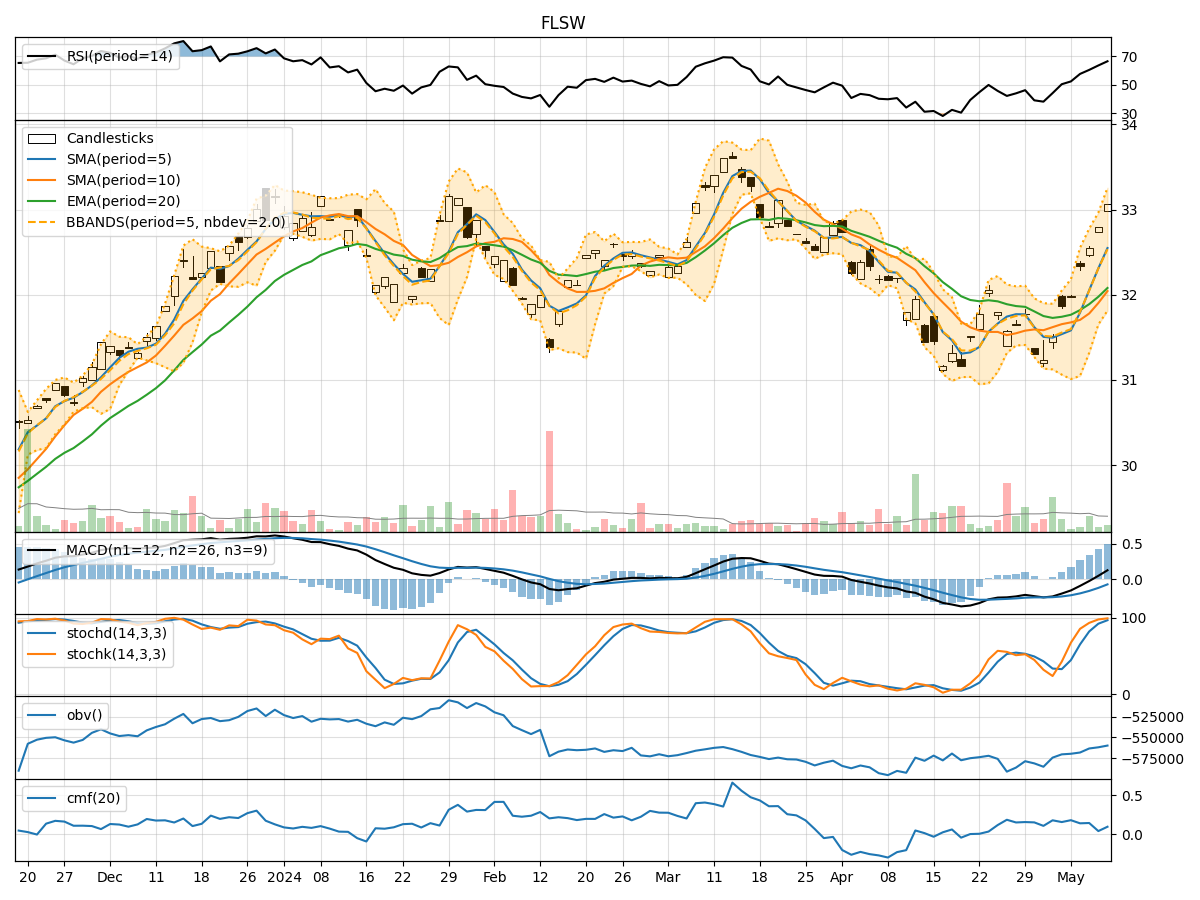
- Moving Averages (MA): The 5-day Moving Average has been consistently rising, indicating a bullish trend in the short term.
- MACD: The MACD line has been positive and increasing, suggesting upward momentum in the stock price.
- EMA: The Exponential Moving Average has been trending upwards, supporting the bullish sentiment in the stock.
Key Observation: The trend indicators point towards a bullish outlook for FLSW in the near future.
Momentum Indicators:
- RSI: The Relative Strength Index has been increasing, showing strengthening buying momentum.
- Stochastic Oscillator: Both %K and %D have been in the overbought territory, indicating a strong upward momentum.
- Williams %R: The indicator has been hovering near the oversold region, suggesting a potential reversal to the upside.
Key Observation: Momentum indicators signal a strong bullish momentum for FLSW.
Volatility Indicators:
- Bollinger Bands: The bands have been widening, indicating increased volatility in the stock price.
- Bollinger %B: The %B has been fluctuating within the bands, reflecting the volatility in the price movements.
Key Observation: Volatility indicators suggest increased volatility in the stock, which could lead to significant price swings.
Volume Indicators:
- On-Balance Volume (OBV): The OBV has been negative, indicating distribution in the stock.
- Chaikin Money Flow (CMF): The CMF has been positive but declining, suggesting weakening buying pressure.
Key Observation: Volume indicators show a mixed signal with distribution in OBV and weakening buying pressure in CMF.
Conclusion:
Based on the analysis of trend, momentum, volatility, and volume indicators, the overall outlook for FLSW is strongly bullish in the near term. The positive trend indicators, strong momentum, and increased volatility point towards a potential upward movement in the stock price. However, the mixed signals in volume indicators warrant caution, as distribution and weakening buying pressure could impact the price action.
Key Conclusion: The next few days are likely to see an upward movement in FLSW stock price, driven by bullish trend and momentum, despite the increased volatility and mixed volume signals. Traders and investors should consider capitalizing on potential buying opportunities in line with the bullish outlook.