Technical Analysis of FLTR 2024-05-10
Overview:
In analyzing the technical indicators for FLTR over the last 5 days, we will delve into the trend, momentum, volatility, and volume indicators to provide a comprehensive outlook on the possible stock price movement in the coming days. By examining key metrics such as moving averages, MACD, RSI, Bollinger Bands, and OBV, we aim to offer valuable insights and recommendations for potential trading strategies.
Trend Indicators:
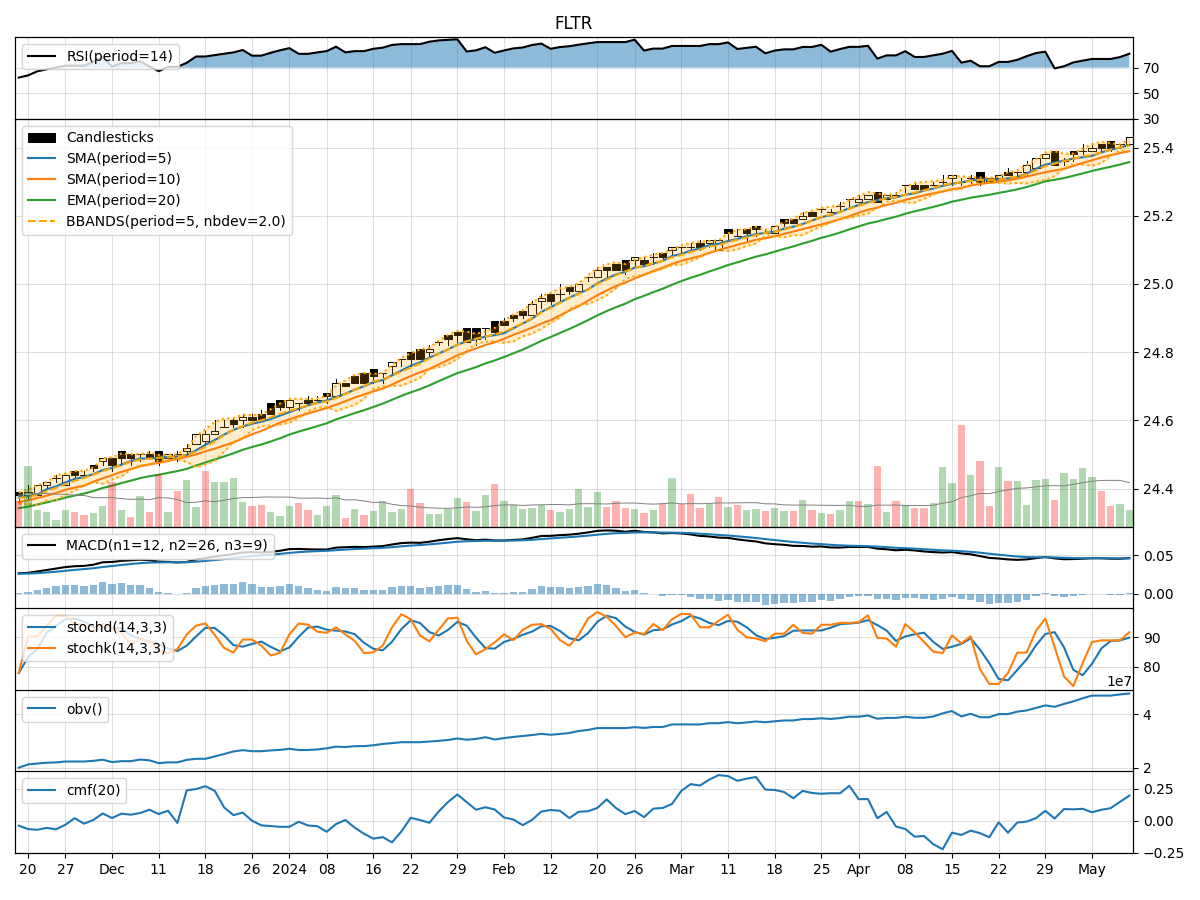
- Moving Averages (MA): The 5-day moving average has been consistently above the closing price, indicating a bullish trend.
- MACD: The MACD line has been positive and increasing, suggesting upward momentum.
- MACD Histogram: The histogram has shown positive values, supporting the bullish trend.
Momentum Indicators:
- RSI: The RSI has been in the overbought territory, indicating strong buying momentum.
- Stochastic Oscillator: Both %K and %D have been in the overbought zone, signaling a potential reversal.
- Williams %R: The indicator has been in the oversold region, suggesting a possible buying opportunity.
Volatility Indicators:
- Bollinger Bands: The stock price has been trading within the bands, indicating normal volatility.
- Bollinger %B: The %B has fluctuated within the bands, reflecting typical price action.
- Bollinger Band Width: The band width has remained relatively stable, suggesting consistent volatility levels.
Volume Indicators:
- On-Balance Volume (OBV): The OBV has shown a positive trend, indicating accumulation by investors.
- Chaikin Money Flow (CMF): The CMF has been positive, suggesting buying pressure in the stock.
Key Observations and Opinions:
- Trend: The stock is in a strong upward trend based on moving averages and MACD.
- Momentum: The momentum indicators suggest a potential reversal due to overbought conditions.
- Volatility: Volatility levels are stable, indicating no significant price fluctuations.
- Volume: Accumulation is evident through OBV and CMF, supporting the bullish bias.
Conclusion:
Based on the technical analysis of trend, momentum, volatility, and volume indicators, the next few days' possible stock price movement for FLTR is likely to be upward with a potential for a short-term correction due to overbought conditions. Traders may consider buying on dips or waiting for a pullback to enter long positions. It is essential to monitor key support and resistance levels for effective risk management.