Technical Analysis of FLUD 2024-05-10
Overview:
In analyzing the technical indicators for FLUD stock over the last 5 days, we will delve into the trend, momentum, volatility, and volume indicators to provide a comprehensive outlook on the possible future stock price movement. By examining these key indicators, we aim to offer valuable insights and predictions for the upcoming trading days.
Trend Analysis:
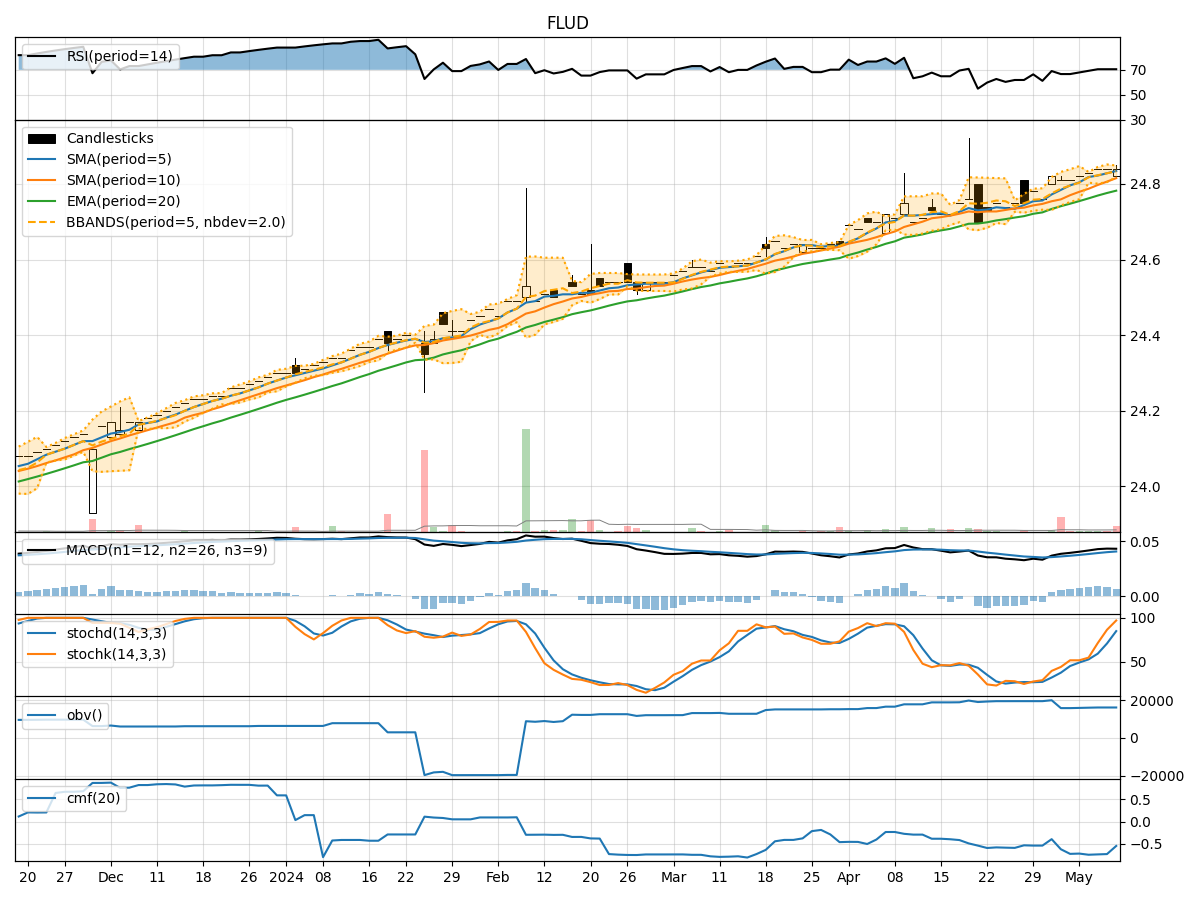
- Moving Averages (MA): The 5-day Moving Average (MA) has been consistently above the Simple Moving Average (SMA) and Exponential Moving Average (EMA), indicating a bullish trend.
- MACD: The MACD line has been positive and above the signal line, suggesting bullish momentum in the stock price.
- MACD Histogram: The MACD Histogram has shown an increasing trend, further supporting the bullish momentum.
Momentum Analysis:
- RSI: The Relative Strength Index (RSI) has been in the overbought territory, indicating a strong bullish momentum.
- Stochastic Oscillator: Both %K and %D lines of the Stochastic Oscillator have been in the overbought zone, signaling a potential reversal or consolidation.
- Williams %R: The Williams %R has been in the oversold region, suggesting a potential reversal to the upside.
Volatility Analysis:
- Bollinger Bands: The Bollinger Bands have shown a narrowing of the bands, indicating decreasing volatility and a possible period of consolidation.
- Bollinger %B: The %B indicator has been hovering around the middle range, suggesting a balanced market sentiment.
Volume Analysis:
- On-Balance Volume (OBV): The OBV indicator has been relatively flat, indicating a lack of significant buying or selling pressure.
- Chaikin Money Flow (CMF): The CMF has been negative, reflecting a bearish money flow in the stock.
Key Observations:
- The trend indicators suggest a strong bullish sentiment in the stock.
- Momentum indicators show signs of potential overbought conditions, hinting at a possible reversal or consolidation.
- Volatility indicators point towards a period of decreased volatility and potential consolidation.
- Volume indicators indicate a lack of significant buying interest, reflecting a neutral to bearish sentiment.
Conclusion:
Based on the analysis of the technical indicators, the next few days' possible stock price movement for FLUD is likely to experience a consolidation phase. The stock may trade within a narrow range as it digests the recent bullish momentum and awaits further catalysts to drive price action. Traders should be cautious of potential reversals or corrections given the overbought signals in the momentum indicators. It is advisable to closely monitor key support and resistance levels for potential breakout opportunities.