Technical Analysis of FLYD 2024-05-10
Overview:
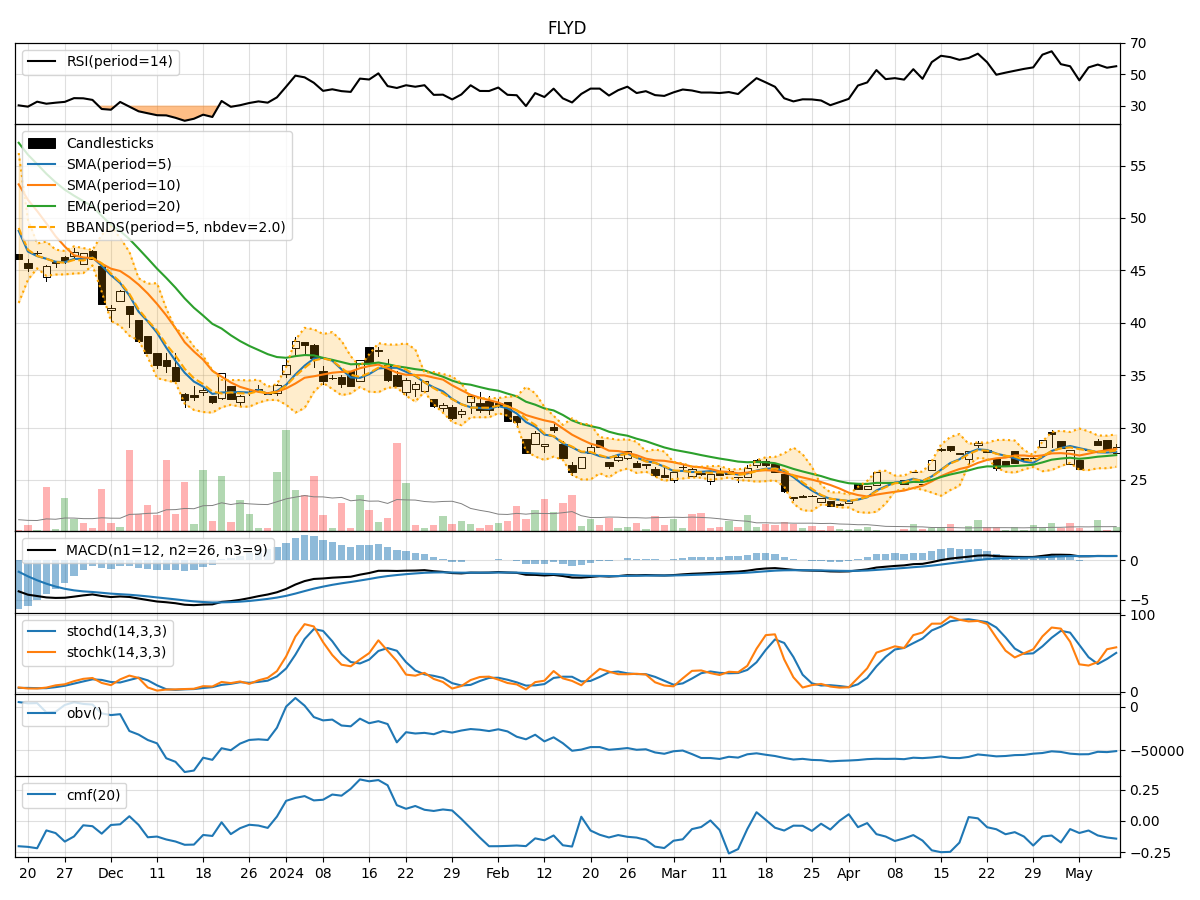
In analyzing the technical indicators for FLYD over the last 5 days, we will delve into the trend, momentum, volatility, and volume indicators to provide a comprehensive outlook on the possible stock price movement. By examining these key aspects, we aim to offer valuable insights and predictions for the upcoming days.
Trend Analysis:
- Moving Averages (MA): The 5-day Moving Average (MA) has been declining, indicating a short-term bearish trend.
- MACD: The MACD line has been consistently below the signal line, suggesting a bearish momentum.
- EMA: The Exponential Moving Average (EMA) has been trending upwards, but the recent price movements have not fully reflected this.
Key Observation: The trend indicators show a mixed signal with a slight bearish bias.
Momentum Analysis:
- RSI: The Relative Strength Index (RSI) has been fluctuating around the neutral zone, indicating indecision in the market.
- Stochastic Oscillator: Both %K and %D have been moving upwards, suggesting a potential bullish momentum.
- Williams %R: The Williams %R is hovering in the oversold territory, signaling a possible reversal.
Key Observation: Momentum indicators are conflicting, with a slight bullish bias emerging.
Volatility Analysis:
- Bollinger Bands (BB): The price has been trading within the bands, indicating a period of consolidation.
- Bollinger Band Width: The Band Width has been relatively stable, suggesting low volatility.
- Bollinger Band %B: %B is around the midpoint, reflecting a balanced market sentiment.
Key Observation: Volatility indicators point towards a period of consolidation and stability.
Volume Analysis:
- On-Balance Volume (OBV): The OBV has been declining, indicating selling pressure in the market.
- Chaikin Money Flow (CMF): The CMF has been negative, suggesting outflow of money from the stock.
Key Observation: Volume indicators support the bearish sentiment in the market.
Conclusion:
Based on the analysis of the technical indicators, the next few days for FLYD stock are likely to see further downside movement. The trend indicators show a bearish bias, while momentum indicators are conflicting but leaning slightly towards a bullish outlook. Volatility indicators suggest a period of consolidation, and volume indicators support the bearish sentiment.
Overall Assessment: The stock is likely to experience a downward trend in the coming days, with potential short-term fluctuations due to conflicting momentum signals. Traders should exercise caution and consider implementing risk management strategies in their trading decisions.