Technical Analysis of FM 2024-05-10
Overview:
In analyzing the technical indicators for the last 5 days of FM stock, we will delve into the trend, momentum, volatility, and volume indicators to provide a comprehensive outlook on the possible stock price movement in the coming days. By examining these key aspects, we aim to offer valuable insights and recommendations for potential investors.
Trend Indicators:
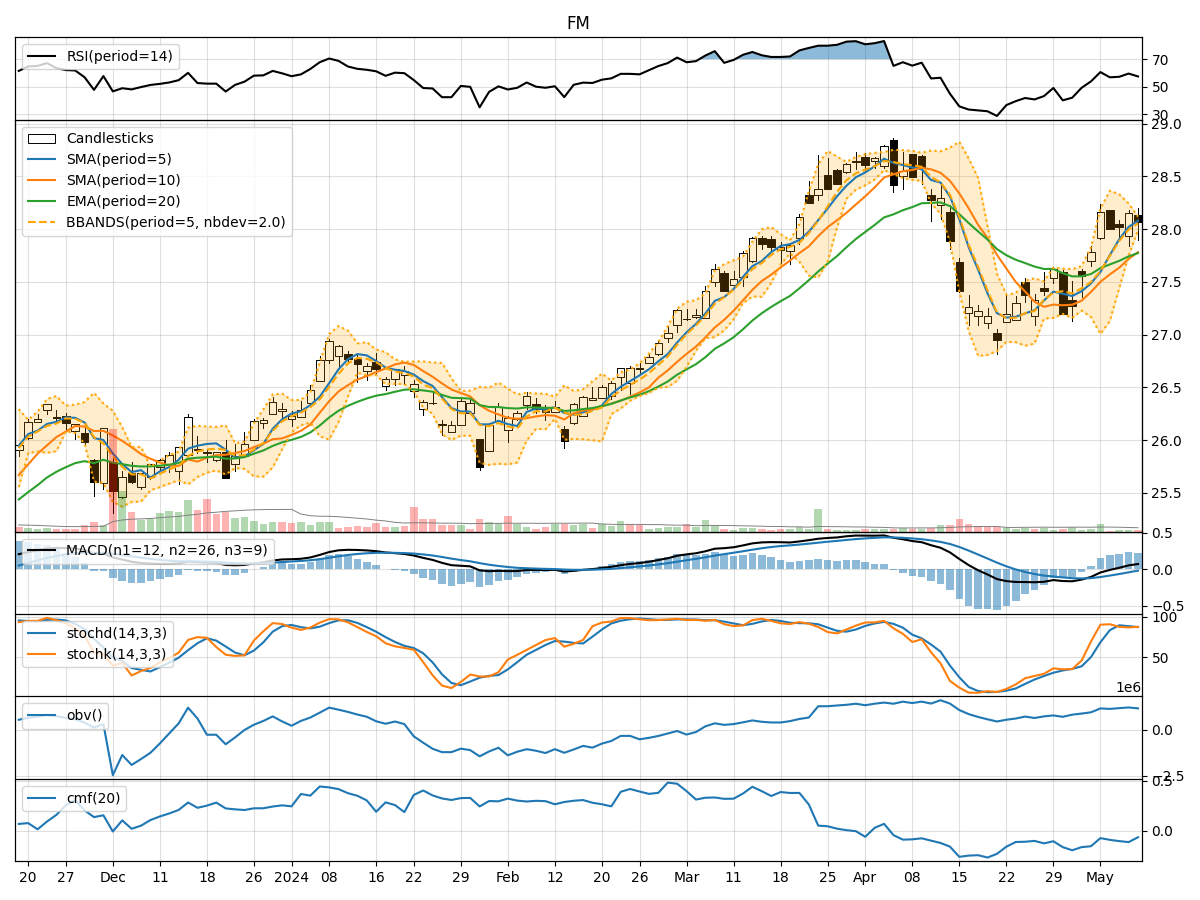
- Moving Averages (MA): The 5-day MA has been consistently above the closing prices, indicating a bullish trend.
- MACD: The MACD line has been consistently above the signal line, suggesting a bullish momentum.
- Relative Strength Index (RSI): The RSI values have been fluctuating around the neutral zone, indicating a lack of strong trend direction.
Momentum Indicators:
- Stochastic Oscillator: Both %K and %D values have been hovering in the overbought territory, signaling a potential reversal.
- Williams %R (WillR): The WillR values have been fluctuating, indicating indecision in the market sentiment.
Volatility Indicators:
- Bollinger Bands (BB): The stock price has been trading within the bands, suggesting a period of consolidation.
- Bollinger %B (BBP): The %B values have been fluctuating around the midline, indicating a lack of clear trend direction.
Volume Indicators:
- On-Balance Volume (OBV): The OBV values have been relatively stable, indicating a balance between buying and selling pressure.
- Chaikin Money Flow (CMF): The CMF values have been negative, suggesting a bearish sentiment in the market.
Key Observations:
- The trend indicators suggest a bullish bias in the short term.
- Momentum indicators show signs of potential overbought conditions.
- Volatility indicators point towards a period of consolidation.
- Volume indicators indicate a lack of strong buying interest.
Conclusion:
Based on the analysis of the technical indicators, the next few days for FM stock are likely to see sideways movement with a slight upward bias. Traders should exercise caution as the stock may experience a period of consolidation before establishing a clear trend direction. It is advisable to closely monitor key support and resistance levels for potential entry and exit points.