Technical Analysis of FMAG 2024-05-10
Overview:
In analyzing the technical indicators for FMAG stock over the last 5 days, we will delve into the trend, momentum, volatility, and volume indicators to provide a comprehensive outlook on the possible future stock price movement. By examining these key indicators, we aim to offer valuable insights and recommendations for potential investors.
Trend Analysis:
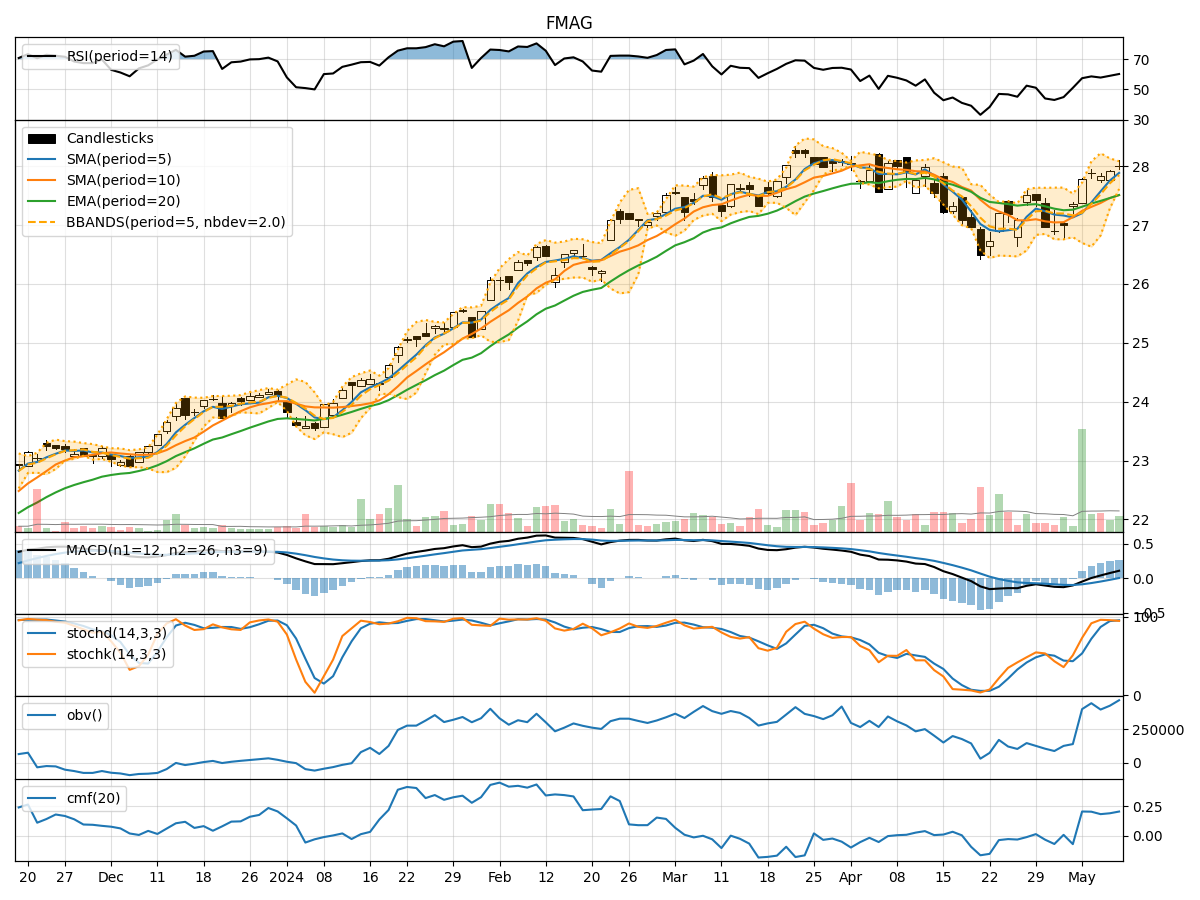
- Moving Averages (MA): The 5-day Moving Average (MA) has been consistently trending upwards, indicating a positive momentum in the stock price.
- MACD: The Moving Average Convergence Divergence (MACD) has shown a positive trend with the MACD line consistently above the signal line, suggesting bullish momentum.
- EMA: The Exponential Moving Average (EMA) has also been on an upward trajectory, further supporting the bullish outlook.
Momentum Analysis:
- RSI: The Relative Strength Index (RSI) has been gradually increasing, reaching a level above 50, indicating strengthening momentum.
- Stochastic Oscillator: Both %K and %D lines of the Stochastic Oscillator have been in the overbought zone, suggesting a potential reversal or consolidation in the near term.
- Williams %R: The Williams %R indicator has been fluctuating in the oversold territory, signaling a possible reversal in the stock price.
Volatility Analysis:
- Bollinger Bands: The Bollinger Bands have been narrowing, indicating decreasing volatility in the stock price.
- Bollinger %B: The %B indicator has been hovering around 1, suggesting that the stock price is trading close to the upper band, potentially indicating an overbought condition.
Volume Analysis:
- On-Balance Volume (OBV): The OBV indicator has shown a positive trend, indicating that volume has been higher on days with upward price movements.
- Chaikin Money Flow (CMF): The CMF has been positive, reflecting buying pressure in the stock.
Key Observations:
- The trend indicators suggest a bullish outlook with moving averages and MACD signaling upward momentum.
- Momentum indicators show a mix of overbought and oversold conditions, indicating a potential reversal or consolidation.
- Volatility has been decreasing, which could lead to a period of consolidation or a potential breakout.
- Volume indicators support the bullish trend, with OBV showing accumulation and CMF indicating buying pressure.
Conclusion:
Based on the analysis of the technical indicators, the next few days for FMAG stock are likely to see continued upward movement. The bullish trend supported by moving averages, MACD, RSI, and positive volume indicators suggests that the stock price is poised for further gains. However, caution is advised as the stochastic oscillator signals potential overbought conditions, which could lead to a short-term pullback or consolidation. Overall, the outlook remains bullish with a potential for further upside in the coming days.