Technical Analysis of FMCX 2024-05-10
Overview:
In analyzing the technical indicators for FMCX over the last 5 days, we will delve into the trend, momentum, volatility, and volume indicators to provide a comprehensive outlook on the possible stock price movement in the coming days.
Trend Indicators:
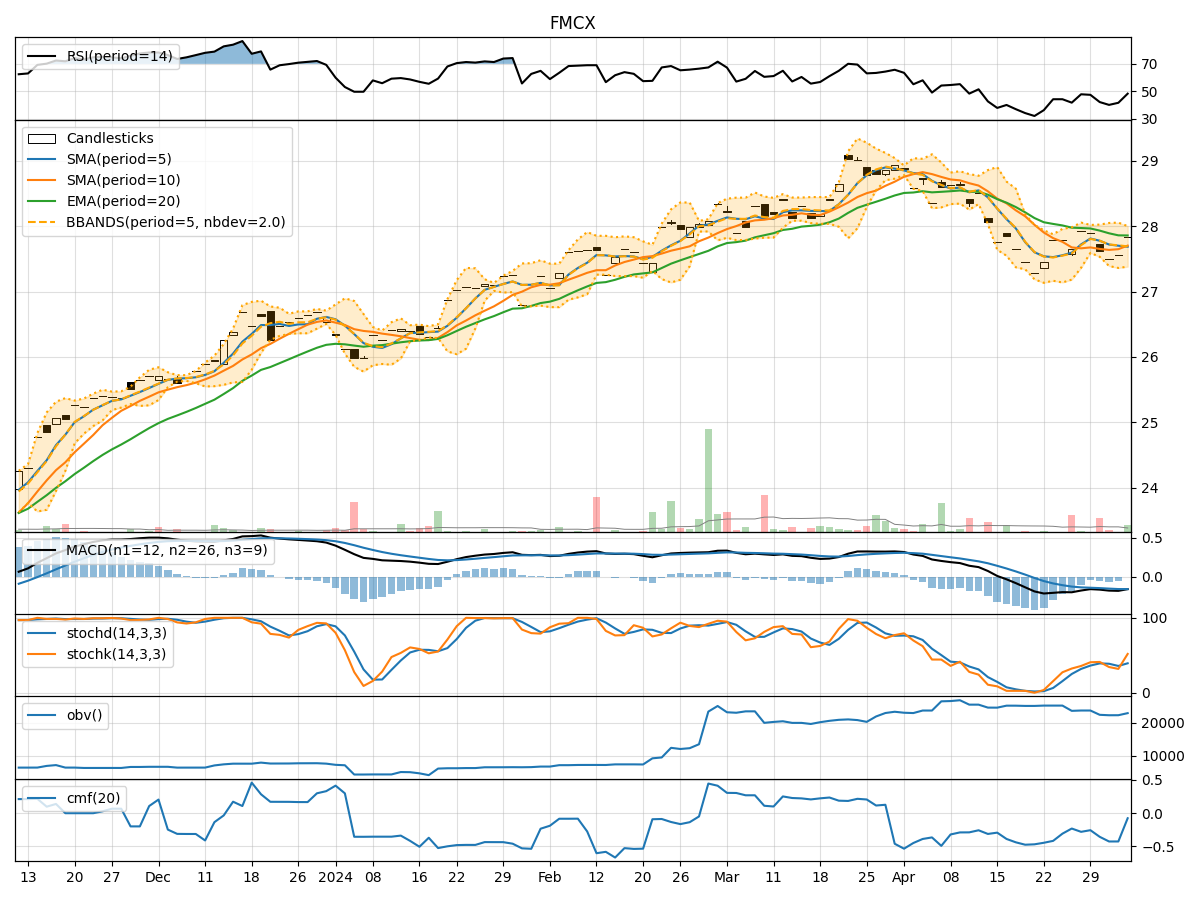
- Moving Averages (MA): The 5-day MA has been consistently above the 10-day SMA, indicating a short-term bullish trend. The EMA(20) has been trending upwards, suggesting a positive momentum in the stock price.
- MACD: The MACD line has been above the signal line, with both lines showing an upward trend. This signals a bullish momentum in the stock.
- Conclusion: The trend indicators suggest an upward momentum in the stock price.
Momentum Indicators:
- RSI: The RSI has been gradually increasing and is currently in the neutral zone, indicating potential room for further upside.
- Stochastic Oscillator: Both %K and %D have been in the overbought zone, suggesting a strong bullish momentum.
- Williams %R: The Williams %R is close to the oversold territory, indicating a potential reversal.
- Conclusion: The momentum indicators suggest a bullish sentiment in the stock.
Volatility Indicators:
- Bollinger Bands (BB): The stock price has been trading within the upper Bollinger Band, indicating an overbought condition. The bands are relatively narrow, suggesting a period of low volatility.
- Conclusion: The volatility indicators point towards a consolidation phase with a potential for a breakout.
Volume Indicators:
- On-Balance Volume (OBV): The OBV has been showing a slight increase, indicating a positive accumulation of the stock.
- Chaikin Money Flow (CMF): The CMF has been negative, suggesting a slight outflow of money from the stock.
- Conclusion: The volume indicators show a mixed signal with a slight bullish bias.
Overall Conclusion:
Based on the analysis of the technical indicators, the stock of FMCX is likely to experience further upward movement in the coming days. The trend indicators, momentum indicators, and volume indicators all point towards a bullish sentiment in the stock. However, the volatility indicators suggest a period of consolidation before a potential breakout.
Recommendation:
Considering the overall bullish outlook, investors may consider buying or holding their positions in FMCX. It is important to monitor the price action closely for any signs of a reversal or a breakout. Additionally, incorporating risk management strategies is crucial to navigate potential market fluctuations.
Disclaimer:
This analysis is based solely on technical indicators and historical data. It is important to conduct thorough research and consider other fundamental factors before making any investment decisions. Market conditions can change rapidly, so staying informed and adapting to new information is essential for successful trading.