Technical Analysis of FMDE 2024-05-10
Overview:
In analyzing the technical indicators for FMDE stock over the last 5 days, we will delve into the trend, momentum, volatility, and volume indicators to provide a comprehensive outlook on the possible stock price movement in the coming days. By examining these key indicators, we aim to offer valuable insights and predictions for informed decision-making.
Trend Analysis:
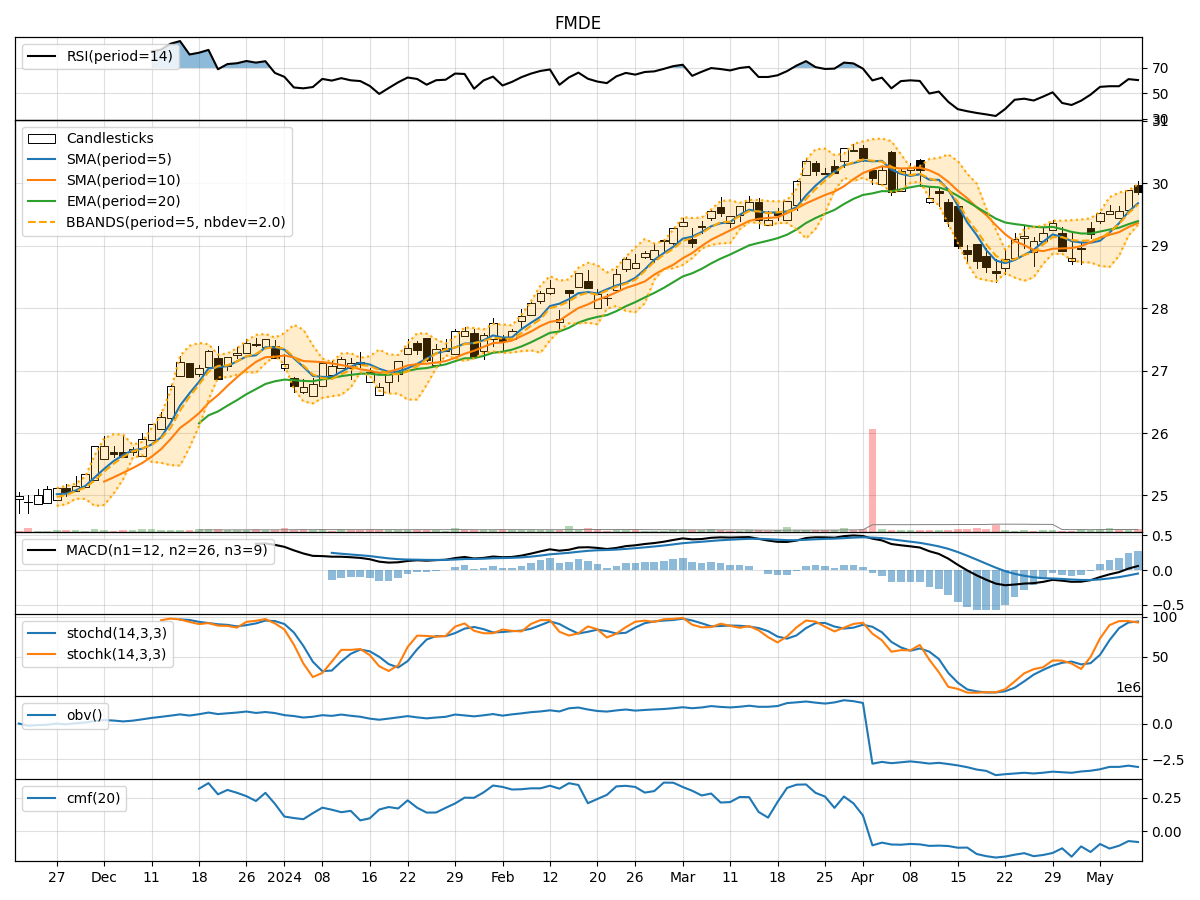
- Moving Averages (MA): The 5-day Moving Average (MA) has been consistently above the Simple Moving Average (SMA) and Exponential Moving Average (EMA), indicating a short-term uptrend.
- MACD: The MACD line has been positive, with the MACD Histogram showing an increasing trend, suggesting bullish momentum.
- Conclusion: The trend indicators point towards an upward movement in the stock price.
Momentum Analysis:
- RSI: The Relative Strength Index (RSI) has been fluctuating around the neutral zone, indicating indecision in the market.
- Stochastic Oscillator: Both %K and %D have been in the overbought territory, signaling a potential reversal.
- Conclusion: The momentum indicators suggest a sideways movement or a possible reversal in the stock price.
Volatility Analysis:
- Bollinger Bands (BB): The stock price has been trading within the Bollinger Bands, with the bands narrowing, indicating decreasing volatility.
- Conclusion: Volatility indicators imply a consolidation phase in the stock price.
Volume Analysis:
- On-Balance Volume (OBV): The OBV has been relatively stable, indicating a balance between buying and selling pressure.
- Chaikin Money Flow (CMF): The CMF has been negative, suggesting outflow of money from the stock.
- Conclusion: Volume indicators reflect a neutral sentiment in the market.
Overall Conclusion:
Based on the analysis of trend, momentum, volatility, and volume indicators, the next few days' possible stock price movement for FMDE is likely to be sideways with a slight upward bias. The trend indicators support an upward movement, while momentum indicators signal a potential reversal or sideways movement. Volatility indicators point towards consolidation, and volume indicators indicate a neutral sentiment.
Recommendation:
Considering the mixed signals from the technical indicators, it is advisable for investors to exercise caution and closely monitor the stock price movement. Traders may consider implementing risk management strategies to navigate the potential volatility and uncertainty in the market. Additionally, keeping an eye on key support and resistance levels can help in making well-informed trading decisions.
In conclusion, while the overall outlook suggests a sideways movement with a slight upward bias, it is essential to remain vigilant and adapt to changing market conditions to optimize trading outcomes.