Technical Analysis of FMHI 2024-05-10
Overview:
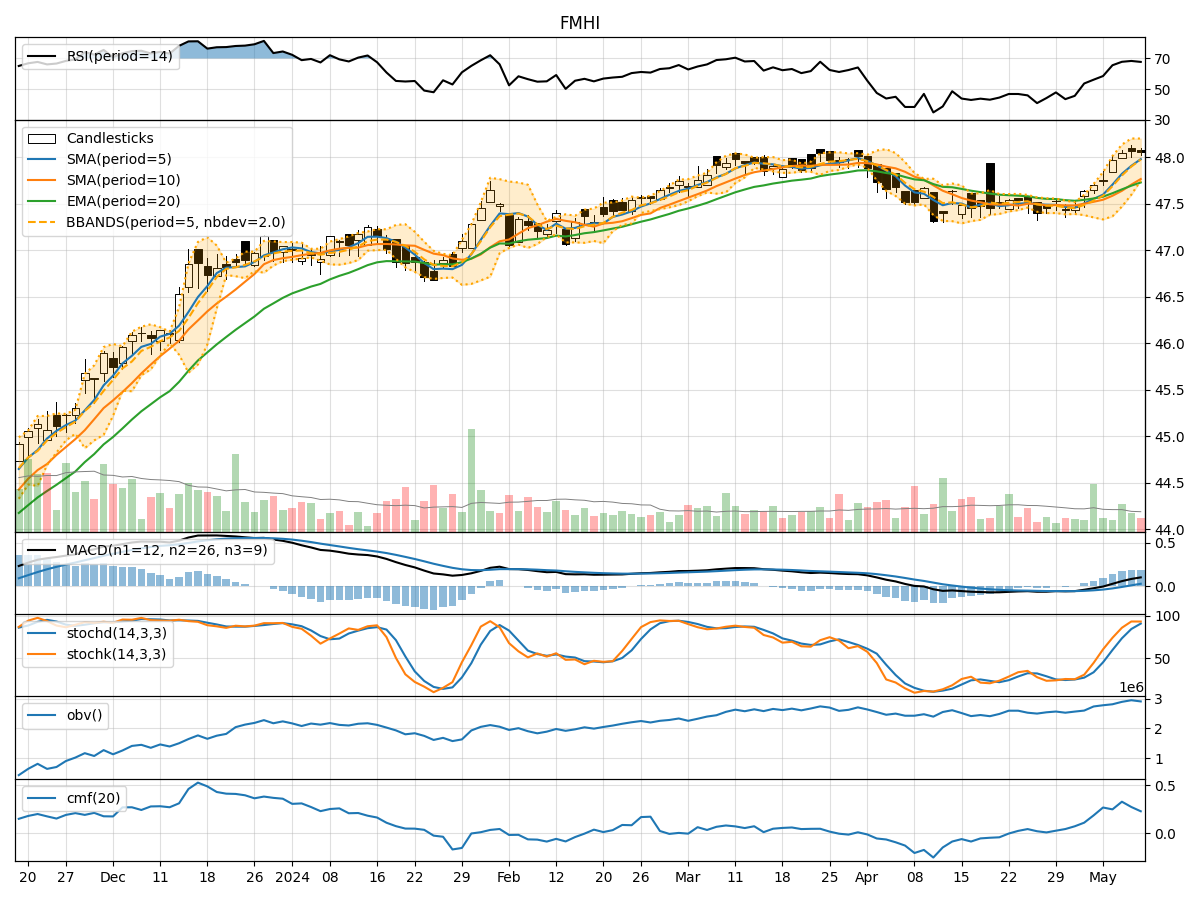
In analyzing the technical indicators for FMHI stock over the last 5 days, we will delve into the trends, momentum, volatility, and volume aspects to provide a comprehensive outlook on the possible stock price movement in the coming days. By examining key indicators such as moving averages, MACD, RSI, Bollinger Bands, and OBV, we aim to offer valuable insights and predictions for informed decision-making.
Trend Analysis:
- Moving Averages (MA): The 5-day MA has been consistently above the closing prices, indicating a short-term uptrend.
- MACD: The MACD line has been above the signal line, with both showing positive values, suggesting bullish momentum.
Momentum Analysis:
- RSI: The RSI has been in the overbought territory, indicating strong buying momentum.
- Stochastic Oscillator: Both %K and %D have been in the overbought zone, signaling potential for a pullback.
Volatility Analysis:
- Bollinger Bands (BB): The stock price has been trading within the upper Bollinger Band, suggesting an overbought condition.
Volume Analysis:
- On-Balance Volume (OBV): The OBV has been increasing, indicating accumulation by investors.
Key Observations:
- The stock is exhibiting signs of bullish momentum based on moving averages and MACD.
- However, the overbought conditions indicated by RSI and Stochastic Oscillator suggest a potential reversal or consolidation.
- The increasing OBV reflects positive volume accumulation, supporting the bullish bias.
- The stock price nearing the upper Bollinger Band implies a possible correction or consolidation in the short term.
Conclusion:
Based on the technical indicators and analysis: - Short-Term View: The stock may experience a pullback or consolidation in the coming days due to overbought conditions. - Long-Term View: The overall trend remains bullish, supported by positive volume accumulation.
Recommendation:
- Caution: Investors should be cautious of a potential short-term correction or consolidation.
- Entry/Exit Points: Consider entering or adding to positions on pullbacks and exiting or taking profits near overbought levels.
- Monitor: Keep a close watch on price action and key indicators for timely decision-making.
Disclaimer:
This analysis is based on technical indicators and historical data, and market conditions can change rapidly. It is essential to conduct thorough research and consider other factors before making investment decisions. Consulting with a financial advisor is recommended for personalized guidance tailored to individual risk tolerance and investment goals.