Technical Analysis of FMQQ 2024-05-10
Overview:
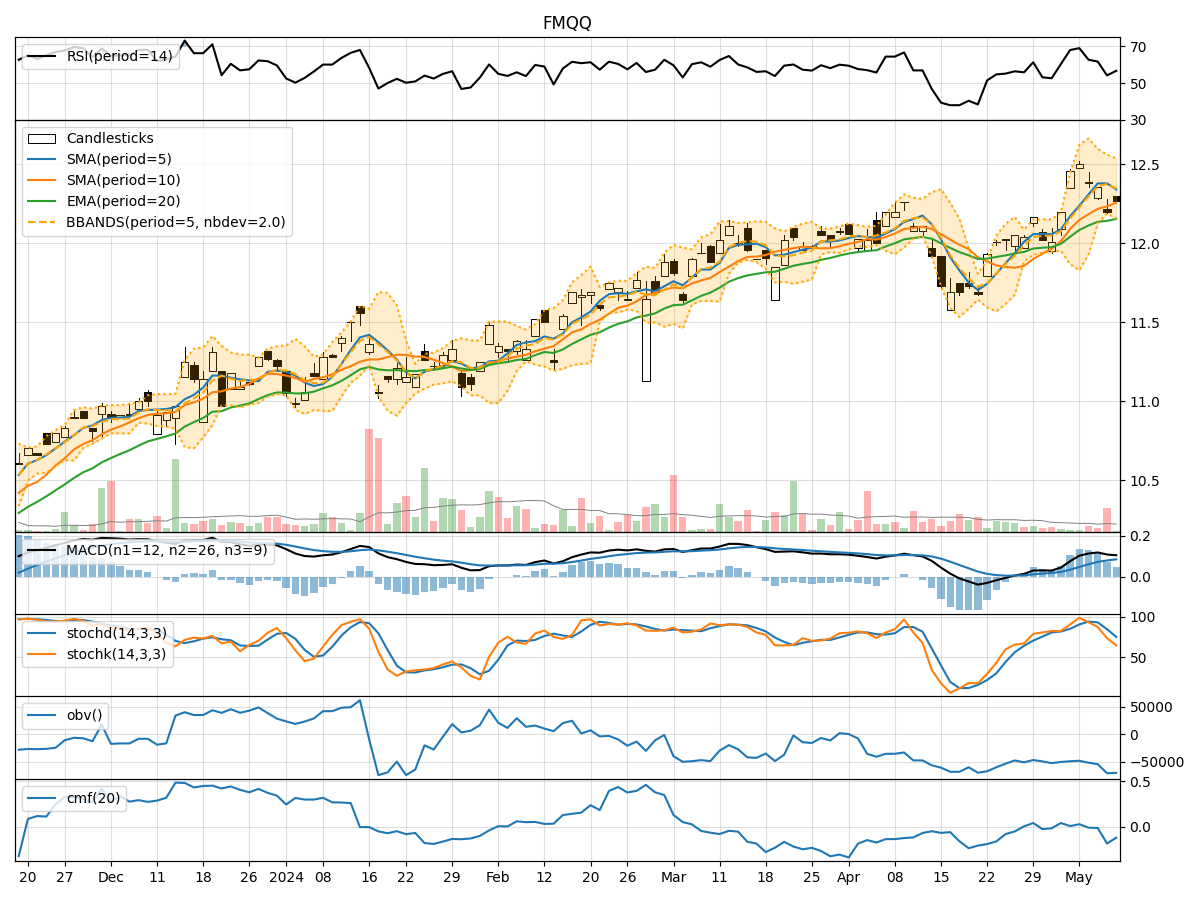
In the last 5 trading days, the stock price of FMQQ has shown some fluctuations with varying volumes. The trend indicators suggest a slightly positive trend, while momentum indicators show a mixed sentiment. Volatility indicators indicate a narrowing of the Bollinger Bands, and volume indicators reflect a decrease in On-Balance Volume (OBV) and Chaikin Money Flow (CMF).
Trend Indicators:
- Moving averages (MA) have been gradually increasing, indicating a positive trend.
- Exponential Moving Average (EMA) is also on an upward trajectory.
- Moving Average Convergence Divergence (MACD) and its signal line are both positive, suggesting bullish momentum.
Momentum Indicators:
- Relative Strength Index (RSI) has been fluctuating but is currently in the neutral zone.
- Stochastic Oscillator shows a downward trend, indicating potential selling pressure.
- Williams %R (WILLR) is in the oversold region, suggesting a possible reversal.
Volatility Indicators:
- Bollinger Bands are narrowing, indicating reduced price volatility.
- Bollinger Band Percentage (BBP) is decreasing, reflecting a consolidation phase.
Volume Indicators:
- On-Balance Volume (OBV) has been declining, signaling a decrease in buying pressure.
- Chaikin Money Flow (CMF) is also negative, indicating a bearish sentiment.
Key Observations:
- Trend: The stock is in an upward trend based on moving averages and MACD.
- Momentum: Mixed signals with RSI neutral, Stochastic showing selling pressure, and Williams %R in oversold territory.
- Volatility: Bollinger Bands are narrowing, suggesting a period of consolidation.
- Volume: Both OBV and CMF are negative, indicating a decrease in buying interest.
Conclusion:
Based on the technical indicators and analysis: - The stock is likely to continue its upward trend in the short term. - Momentum indicators suggest a mixed sentiment with a possibility of a minor pullback. - Volatility indicators point towards a consolidation phase with reduced price fluctuations. - Volume indicators indicate a decrease in buying pressure, which could lead to some price consolidation.
Recommendation:
Considering the overall analysis, it is advisable to hold existing positions in FMQQ for now. Traders may consider buying on dips during any potential pullbacks. However, it is essential to monitor the momentum indicators closely for any signs of a trend reversal. Additionally, keeping an eye on volume movements can provide insights into the stock's future price action.