Technical Analysis of FNDA 2024-05-10
Overview:
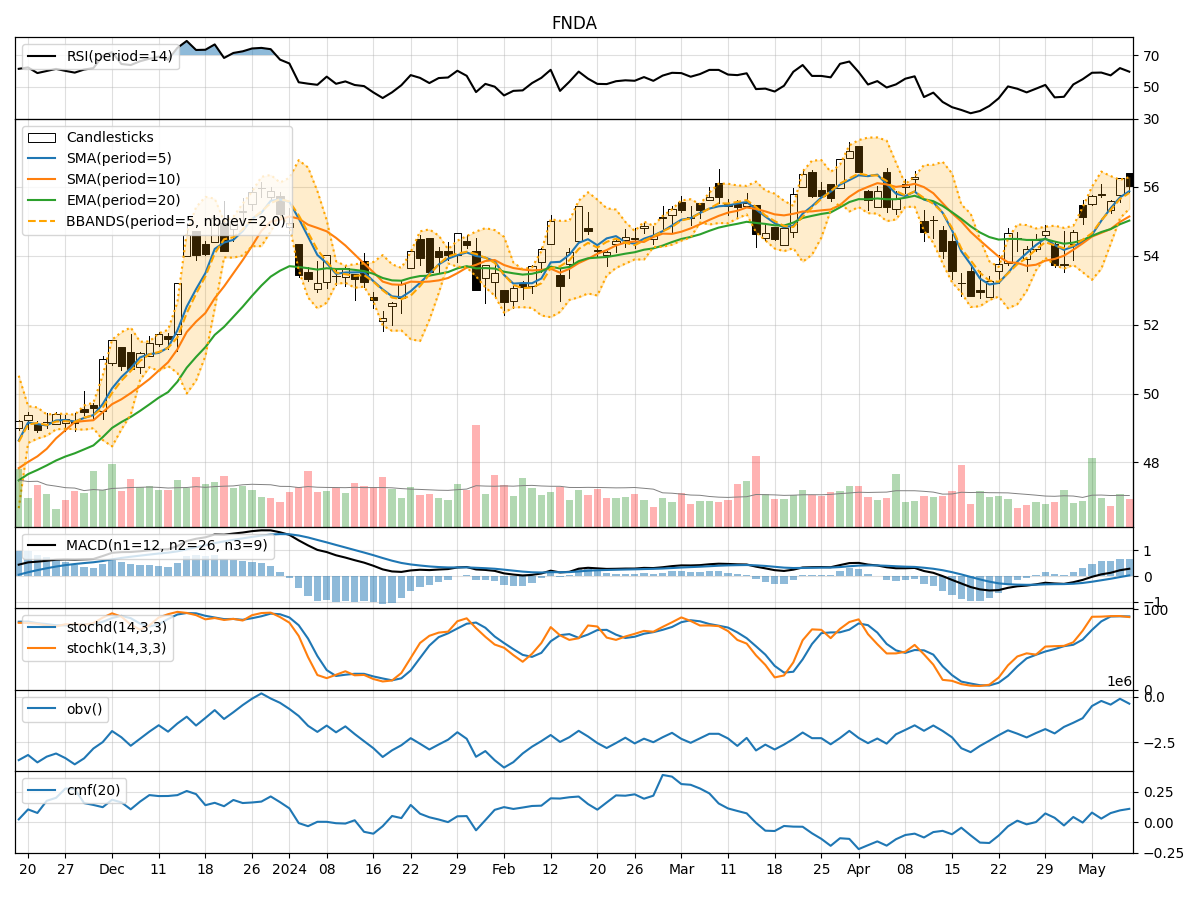
In the last 5 trading days, FNDA has shown a mix of bullish and bearish signals across various technical indicators. The stock price has been fluctuating within a certain range, indicating a potential consolidation phase. Let's delve deeper into the analysis of trend, momentum, volatility, and volume indicators to determine the possible stock price movement in the next few days.
Trend Indicators:
- Moving Averages (MA): The 5-day MA has been trending above the 10-day SMA, indicating short-term bullish momentum. However, the EMA(20) has been relatively flat, suggesting a lack of strong trend direction.
- MACD: The MACD line has been consistently above the signal line, indicating bullish momentum. The MACD histogram has shown a slight decrease in positive momentum in the last two days.
Momentum Indicators:
- RSI: The RSI has been fluctuating around the overbought territory, indicating a potential overvalued condition. This could lead to a short-term pullback in the stock price.
- Stochastic Oscillator: Both %K and %D lines have been in the overbought zone, suggesting a possible reversal in the near term.
Volatility Indicators:
- Bollinger Bands: The stock price has been trading within the Bollinger Bands, indicating a period of consolidation. The bands have started to narrow, suggesting a potential decrease in volatility.
- Bollinger %B: The %B indicator has been hovering around the middle range, indicating a balanced market sentiment.
Volume Indicators:
- On-Balance Volume (OBV): The OBV has shown a slight increase in the last few days, indicating some accumulation by investors. This could support a potential upward movement in the stock price.
- Chaikin Money Flow (CMF): The CMF has been positive, indicating buying pressure in the stock. However, the rate of increase has slowed down in the recent days.
Conclusion:
Based on the analysis of technical indicators, the stock is likely to experience a short-term pullback or consolidation in the next few days. The overbought conditions in the RSI and Stochastic Oscillator, coupled with the narrowing Bollinger Bands, suggest a potential decrease in volatility and a period of sideways movement. Investors should exercise caution and consider waiting for clearer signals before making any significant trading decisions.