Technical Analysis of FNDE 2024-05-10
Overview:
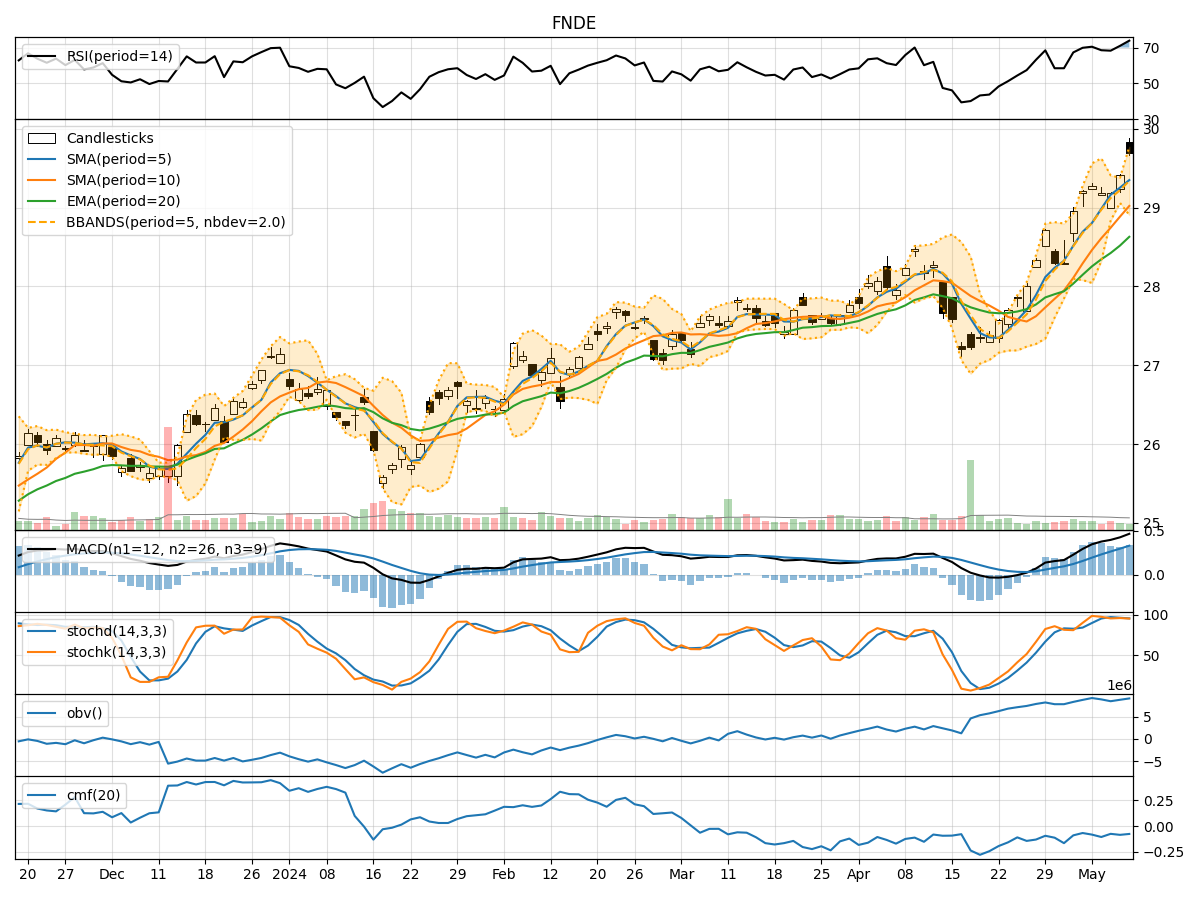
In analyzing the technical indicators for FNDE over the last 5 days, we will delve into the trend, momentum, volatility, and volume indicators to provide a comprehensive outlook on the possible stock price movement. By examining these key aspects, we aim to offer valuable insights and predictions for the upcoming days.
Trend Indicators:
- Moving Averages (MA): The 5-day MA has been consistently above the closing prices, indicating a bullish trend.
- MACD: The MACD line has been above the signal line, suggesting a positive momentum in the stock price.
- RSI: The RSI values have been relatively high, indicating overbought conditions.
Momentum Indicators:
- Stochastic Oscillator: Both %K and %D values have been high, signaling a strong upward momentum.
- Williams %R: The values have been in the oversold territory, indicating a potential reversal.
Volatility Indicators:
- Bollinger Bands: The stock price has been trading within the bands, suggesting a period of consolidation.
- Average True Range (ATR): The ATR values have been relatively stable, indicating consistent volatility levels.
Volume Indicators:
- On-Balance Volume (OBV): The OBV has been fluctuating, indicating mixed buying and selling pressure.
- Chaikin Money Flow (CMF): The CMF values have been negative, suggesting outflow of money from the stock.
Key Observations:
- The trend indicators show a strong bullish sentiment with moving averages and MACD supporting an upward trajectory.
- Momentum indicators indicate a robust buying momentum, although RSI suggests potential overbought conditions.
- Volatility indicators point towards a period of consolidation with stable volatility levels.
- Volume indicators reflect mixed sentiment with fluctuating OBV and negative CMF values.
Conclusion:
Based on the analysis of the technical indicators, the next few days' possible stock price movement for FNDE is likely to be upward. The bullish trend supported by moving averages and MACD, coupled with strong momentum indicated by the stochastic oscillator, suggests a continuation of the upward trajectory. However, caution is advised due to the overbought conditions highlighted by RSI. The consolidation phase indicated by volatility indicators may lead to short-term fluctuations, but the overall outlook remains positive. Investors should closely monitor the volume indicators for any shifts in buying or selling pressure to make informed decisions.