Technical Analysis of FNGS 2024-05-10
Overview:
In analyzing the technical indicators for FNGS over the last 5 days, we will delve into the trends, momentum, volatility, and volume indicators to provide a comprehensive outlook on the possible stock price movement. By examining these key aspects, we aim to offer valuable insights and predictions for the upcoming days.
Trend Analysis:
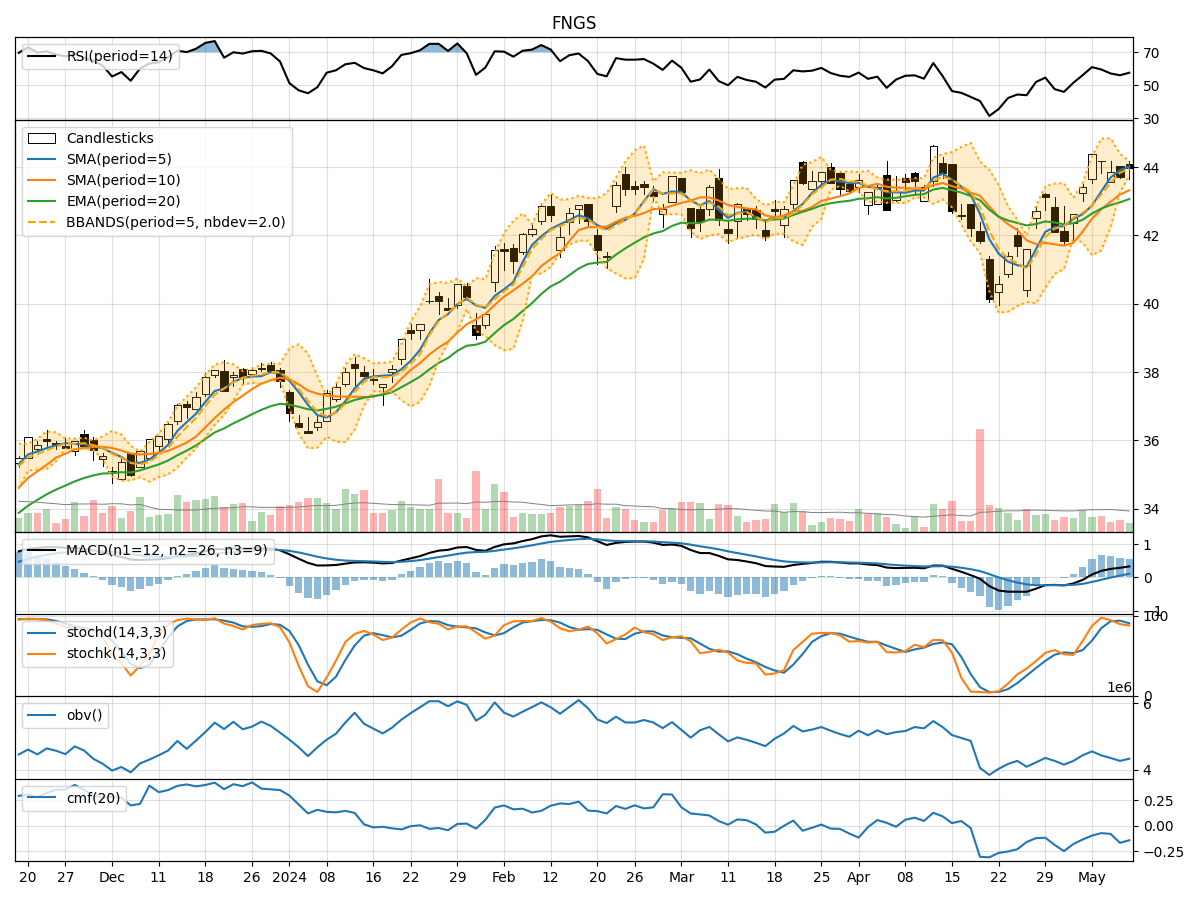
- Moving Averages (MA): The 5-day Moving Average (MA) has been consistently rising, indicating a bullish trend in the short term.
- MACD: The MACD line has been above the signal line for the past few days, suggesting positive momentum in the stock price.
- EMA: The Exponential Moving Average (EMA) has been trending upwards, supporting the bullish sentiment in the market.
Momentum Analysis:
- RSI: The Relative Strength Index (RSI) has been fluctuating around the 50 level, indicating a neutral momentum in the stock.
- Stochastic Oscillator: Both %K and %D have been declining, suggesting a potential reversal in momentum.
- Williams %R: The Williams %R is in oversold territory, indicating a possible buying opportunity.
Volatility Analysis:
- Bollinger Bands: The Bollinger Bands have been narrowing, indicating decreasing volatility in the stock price.
- Bollinger %B: The %B indicator is hovering around the middle band, suggesting a period of consolidation.
- Average True Range (ATR): The ATR has been decreasing, indicating a reduction in price volatility.
Volume Analysis:
- On-Balance Volume (OBV): The OBV has been declining, indicating selling pressure in the stock.
- Chaikin Money Flow (CMF): The CMF has been negative, suggesting outflows from the stock.
Conclusion:
Based on the analysis of the technical indicators, the stock of FNGS is likely to experience sideways movement in the next few days. The bullish trend indicated by the moving averages and MACD may be offset by the neutral momentum reflected in the RSI and stochastic oscillator. The decreasing volatility and negative volume indicators further support the view of consolidation in the stock price. Traders should exercise caution and wait for clearer signals before making significant trading decisions.
Key Takeaways:
- Trend: Upward
- Momentum: Neutral to Bearish
- Volatility: Decreasing
- Volume: Bearish
Recommendation:
Given the mixed signals from the technical indicators, it is advisable for investors to wait for confirmation of a clear trend before taking any significant positions. Monitoring key levels such as support and resistance can provide valuable insights into potential price movements. Additionally, keeping an eye on market news and external factors that may impact the stock can help in making informed decisions.