Technical Analysis of FNGU 2024-05-10
Overview:
In analyzing the technical indicators for FNGU over the last 5 days, we will delve into the trend, momentum, volatility, and volume indicators to provide a comprehensive outlook on the possible stock price movement in the coming days. By examining these key aspects, we aim to offer valuable insights and recommendations for potential investors.
Trend Indicators:
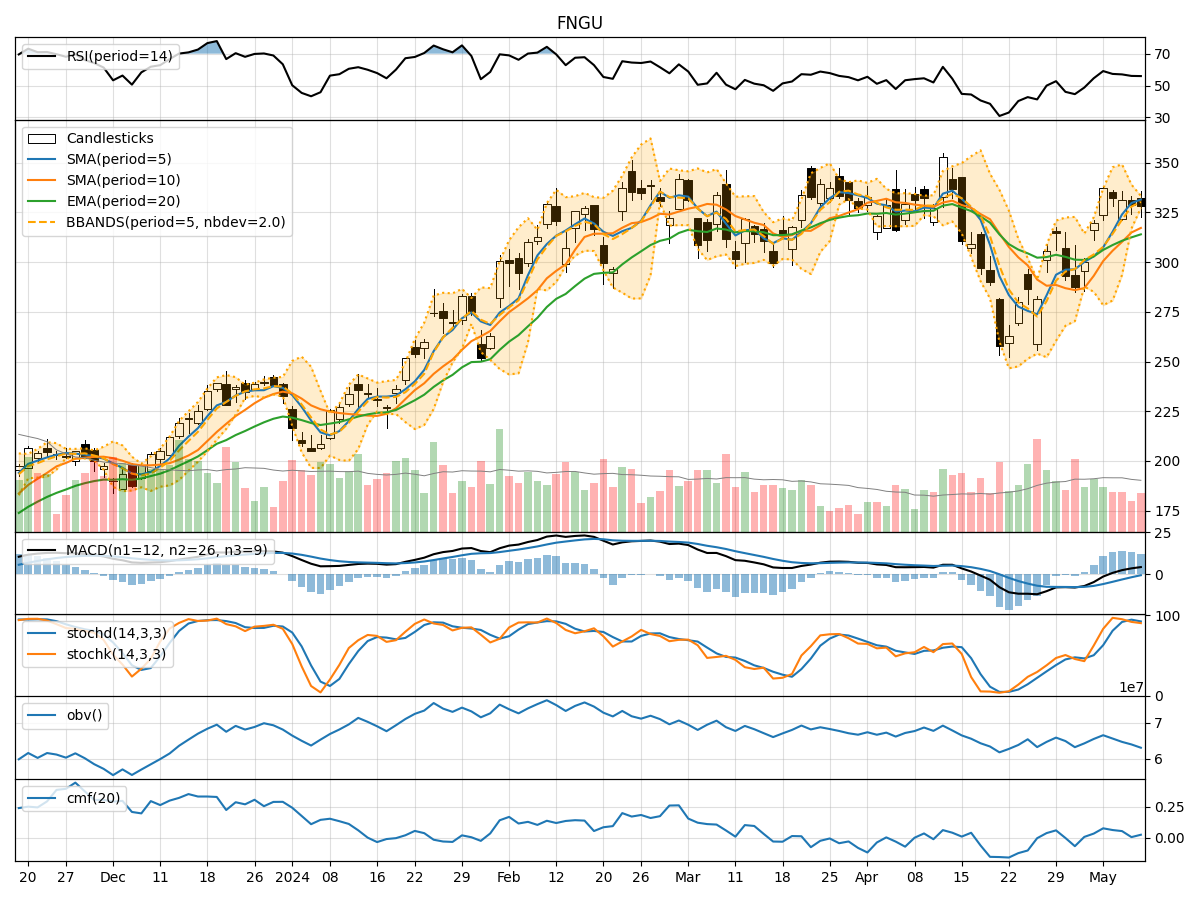
- Moving Averages (MA): The 5-day moving average has been consistently rising, indicating a bullish trend in the short term.
- MACD: The MACD line has been above the signal line for the past few days, suggesting positive momentum.
- EMA: The exponential moving average has also been trending upwards, supporting the bullish sentiment.
Momentum Indicators:
- RSI: The Relative Strength Index has been hovering around 55-60, indicating a neutral stance with potential for either direction.
- Stochastic Oscillator: Both %K and %D have been declining, signaling a potential bearish momentum.
- Williams %R: The indicator is in oversold territory, suggesting a possible reversal to the upside.
Volatility Indicators:
- Bollinger Bands: The bands have been narrowing, indicating decreasing volatility and a potential breakout in either direction.
- Bollinger %B: The %B indicator is currently below 0.5, suggesting a possible oversold condition.
Volume Indicators:
- On-Balance Volume (OBV): The OBV has been declining, indicating selling pressure in the stock.
- Chaikin Money Flow (CMF): The CMF has been relatively stable but on the lower side, suggesting a lack of strong buying interest.
Key Observations and Opinions:
- Trend: The trend indicators point towards a bullish sentiment in the short term.
- Momentum: Mixed signals are observed with RSI neutral, Stochastic showing bearish momentum, and Williams %R in oversold territory.
- Volatility: Decreasing volatility may precede a significant price movement.
- Volume: The declining OBV and relatively low CMF indicate a lack of strong buying interest.
Conclusion:
Based on the analysis of the technical indicators, the next few days' possible stock price movement for FNGU could be sideways with a slight bearish bias. The bullish trend indicated by moving averages and MACD may face resistance due to the mixed momentum signals and lack of strong buying volume. Traders should exercise caution and wait for a clearer direction to emerge before making significant trading decisions.