Technical Analysis of FNOV 2024-05-10
Overview:
In analyzing the technical indicators for FNOV stock over the last 5 days, we will delve into the trend, momentum, volatility, and volume indicators to provide a comprehensive outlook on the possible stock price movement in the coming days. By examining these key aspects, we aim to offer valuable insights and predictions to guide your investment decisions.
Trend Indicators:
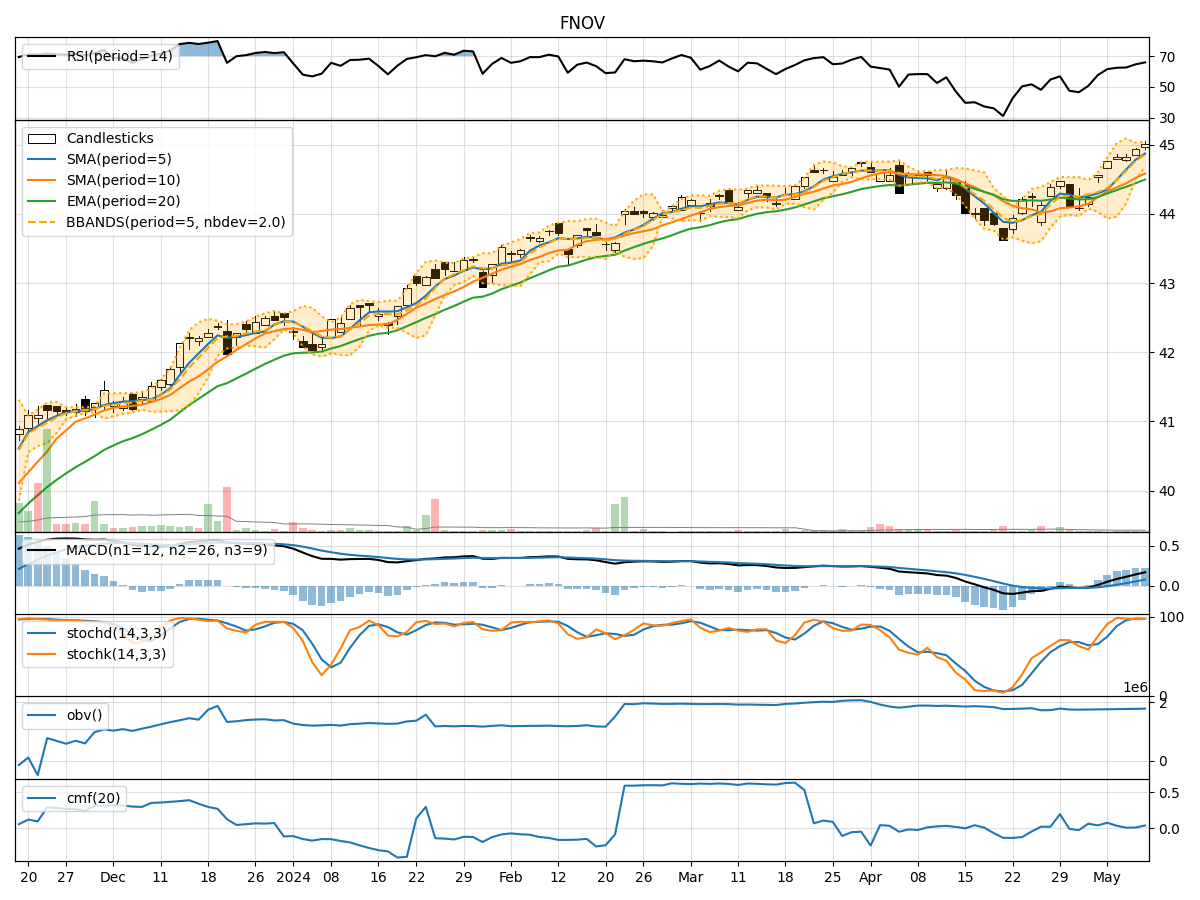
- Moving Averages (MA): The 5-day moving average has been consistently rising, indicating a bullish trend in the short term.
- MACD: The MACD line has been increasing, showing positive momentum in the stock price.
- EMA: The exponential moving average has also been trending upwards, supporting the bullish sentiment.
Momentum Indicators:
- RSI: The Relative Strength Index has been increasing, suggesting that the stock is in an overbought condition.
- Stochastic Oscillator: Both %K and %D have been high, indicating strong upward momentum.
- Williams %R: The Williams %R is in the oversold territory, signaling a potential reversal.
Volatility Indicators:
- Bollinger Bands: The stock price has been trading close to the upper Bollinger Band, indicating high volatility.
- Bollinger Band Width: The band width has been narrowing, suggesting a potential decrease in volatility.
Volume Indicators:
- On-Balance Volume (OBV): The OBV has been steadily increasing, reflecting positive buying pressure.
- Chaikin Money Flow (CMF): The CMF has been positive, indicating money flow into the stock.
Key Observations and Opinions:
- Trend: The stock is in an upward trend supported by moving averages and MACD.
- Momentum: Momentum indicators suggest overbought conditions but with strong upward momentum.
- Volatility: The stock has exhibited high volatility but with signs of potential stabilization.
- Volume: Increasing OBV and positive CMF indicate bullish sentiment among investors.
Conclusion:
Based on the analysis of the technical indicators, the next few days' possible stock price movement for FNOV is likely to be upward. The bullish trend supported by moving averages, MACD, and positive volume indicators suggests that the stock may continue its upward trajectory. However, caution is advised due to the overbought conditions indicated by momentum indicators. Traders and investors should closely monitor the price action and consider implementing risk management strategies to navigate potential market fluctuations.