Technical Analysis of FNX 2024-05-10
Overview:
In analyzing the technical indicators for FNX over the last 5 days, we will delve into the trend, momentum, volatility, and volume indicators to provide a comprehensive outlook on the possible stock price movement in the coming days. By examining these key aspects, we aim to offer valuable insights and predictions for informed decision-making.
Trend Analysis:
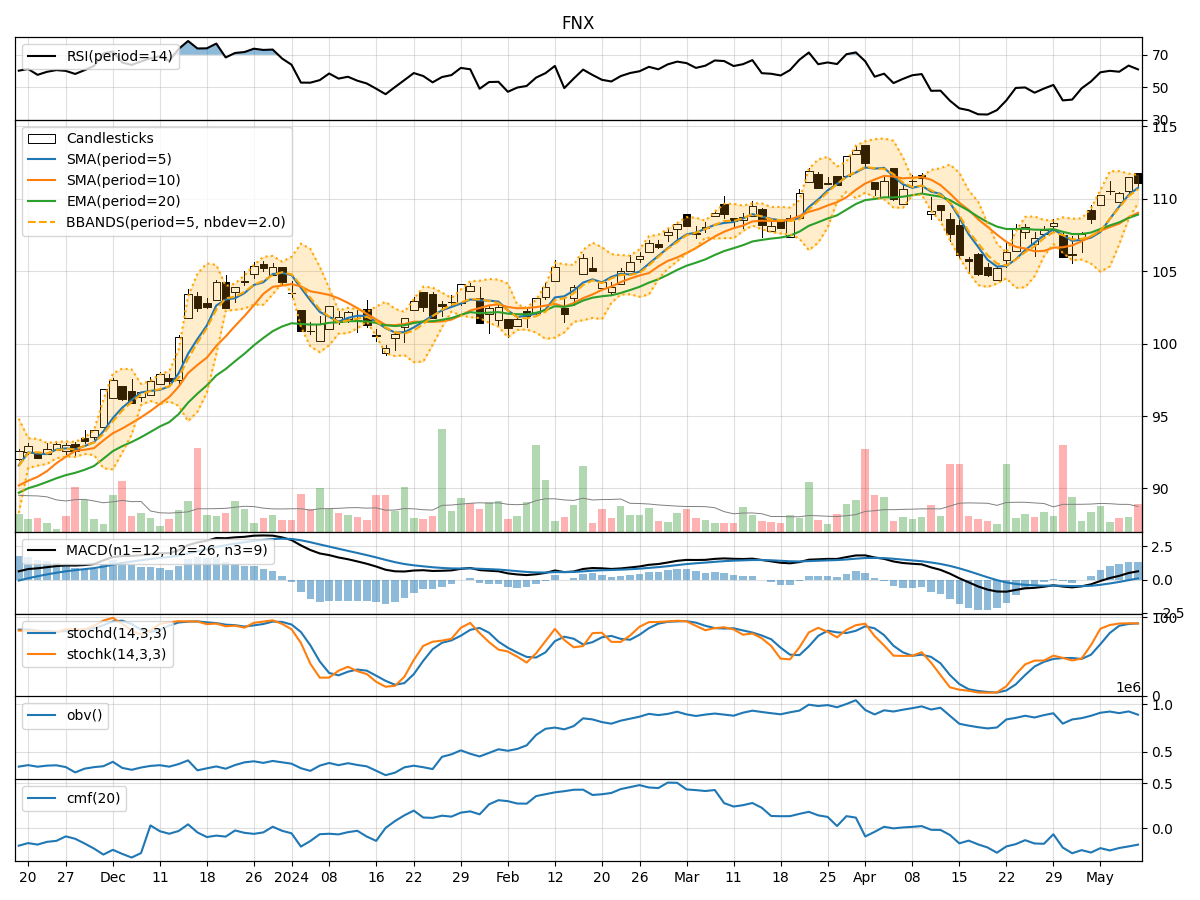
- Moving Averages (MA): The 5-day Moving Average (MA) has been consistently above the Simple Moving Average (SMA) and Exponential Moving Average (EMA), indicating a bullish trend.
- MACD: The MACD line has been above the signal line, with both lines showing an upward trend, suggesting bullish momentum.
- MACD Histogram: The MACD Histogram has been increasing over the past 5 days, indicating strengthening bullish momentum.
Momentum Analysis:
- RSI: The Relative Strength Index (RSI) has been fluctuating around the 60-63 range, indicating a neutral momentum.
- Stochastic Oscillator: Both %K and %D lines of the Stochastic Oscillator have been in the overbought zone, suggesting a potential reversal or consolidation.
- Williams %R: The Williams %R has been hovering around -10 to -12, indicating an overbought condition.
Volatility Analysis:
- Bollinger Bands (BB): The stock price has been trading within the upper Bollinger Band (BBU), suggesting an overbought condition.
- Bollinger Band Width (BBW): The Bollinger Band Width has been decreasing, indicating a potential decrease in volatility.
Volume Analysis:
- On-Balance Volume (OBV): The OBV has been fluctuating, indicating a balance between buying and selling pressure.
- Chaikin Money Flow (CMF): The CMF has been negative, suggesting a bearish money flow trend.
Key Observations and Opinions:
- Trend: The trend indicators suggest a strong bullish sentiment in the short term.
- Momentum: The momentum indicators show mixed signals, with a potential for a reversal or consolidation.
- Volatility: The decreasing Bollinger Band Width indicates a possible decrease in volatility.
- Volume: The OBV and CMF reflect a neutral to bearish sentiment in terms of volume and money flow.
Conclusion:
Based on the analysis of the technical indicators, the next few days' possible stock price movement for FNX is likely to be sideways to slightly bearish. While the trend indicators point towards a bullish sentiment, the mixed signals from momentum indicators and bearish volume indicators suggest a potential consolidation or minor pullback in the stock price. Traders should exercise caution and closely monitor key support and resistance levels for potential entry or exit points.