Technical Analysis of FNY 2024-05-10
Overview:
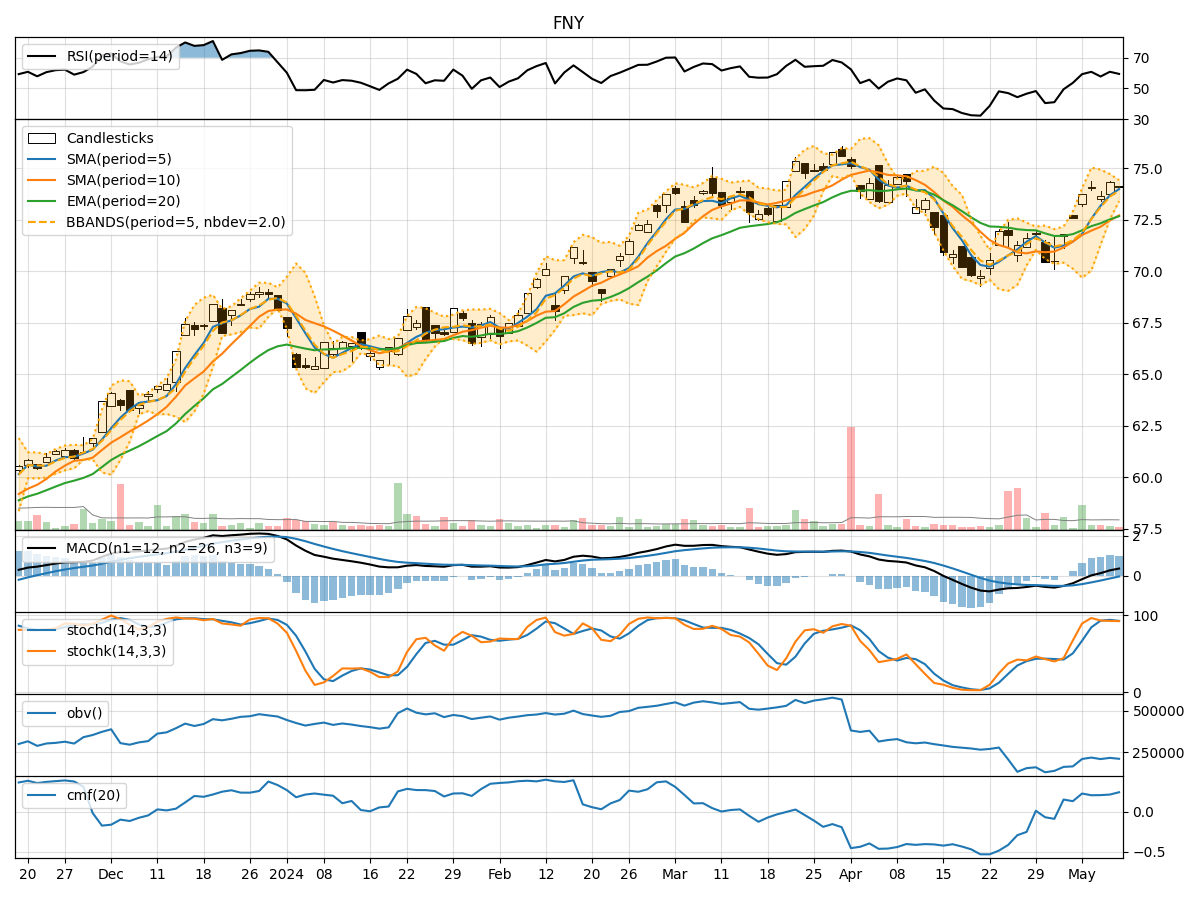
In the last 5 trading days, FNY stock has shown a mix of price movements with some volatility in both price and volume. The trend indicators suggest a gradual uptrend, supported by positive momentum and volume indicators. However, there are signs of potential consolidation or a minor pullback in the near term based on the technical analysis.
Trend Indicators Analysis:
- Moving Averages (MA): The 5-day Moving Average (MA) has been consistently above the Simple Moving Average (SMA) and Exponential Moving Average (EMA), indicating a short-term uptrend.
- MACD: The MACD line has been above the signal line, showing bullish momentum. However, the MACD Histogram has been decreasing, suggesting a potential slowdown in the uptrend.
- Conclusion: The trend indicators overall suggest an upward bias in the stock price, but with some signs of weakening momentum.
Momentum Indicators Analysis:
- RSI: The Relative Strength Index (RSI) has been fluctuating around the overbought territory, indicating strong buying pressure.
- Stochastic Oscillator: Both %K and %D lines have been in the overbought zone, suggesting a potential reversal or pullback.
- Williams %R: The Williams %R is also in the overbought region, signaling a possible correction.
- Conclusion: Momentum indicators point towards a potential pullback or consolidation in the stock price in the short term.
Volatility Indicators Analysis:
- Bollinger Bands: The Bollinger Bands have been narrowing, indicating decreasing volatility and a possible period of consolidation.
- Conclusion: Volatility indicators suggest that the stock price may enter a phase of sideways movement or consolidation in the upcoming days.
Volume Indicators Analysis:
- On-Balance Volume (OBV): The OBV has been fluctuating, indicating indecision among investors.
- Chaikin Money Flow (CMF): The CMF has been positive, suggesting buying pressure.
- Conclusion: Volume indicators show mixed signals, with no clear direction in terms of volume confirmation for the price movement.
Overall Conclusion:
Based on the analysis of trend, momentum, volatility, and volume indicators, the next few days for FNY stock are likely to see a potential consolidation or minor pullback. The trend is still slightly bullish, but momentum indicators suggest a need for a breather or correction. Volatility indicators point towards a sideways movement, while volume indicators do not provide a strong confirmation of the price direction.
Key Recommendations:
- Monitor Price Action: Keep a close eye on the price action for any signs of reversal or continuation.
- Watch Momentum Indicators: Pay attention to momentum indicators for potential shifts in buying or selling pressure.
- Consider Risk Management: Implement proper risk management strategies to protect against potential downside risks.
- Stay Informed: Stay updated on market news and events that could impact FNY stock.
Final Verdict:
The next few days for FNY stock are likely to see sideways movement with a potential for a minor pullback. It is essential to remain cautious and vigilant in your trading decisions to navigate through the upcoming market dynamics effectively.