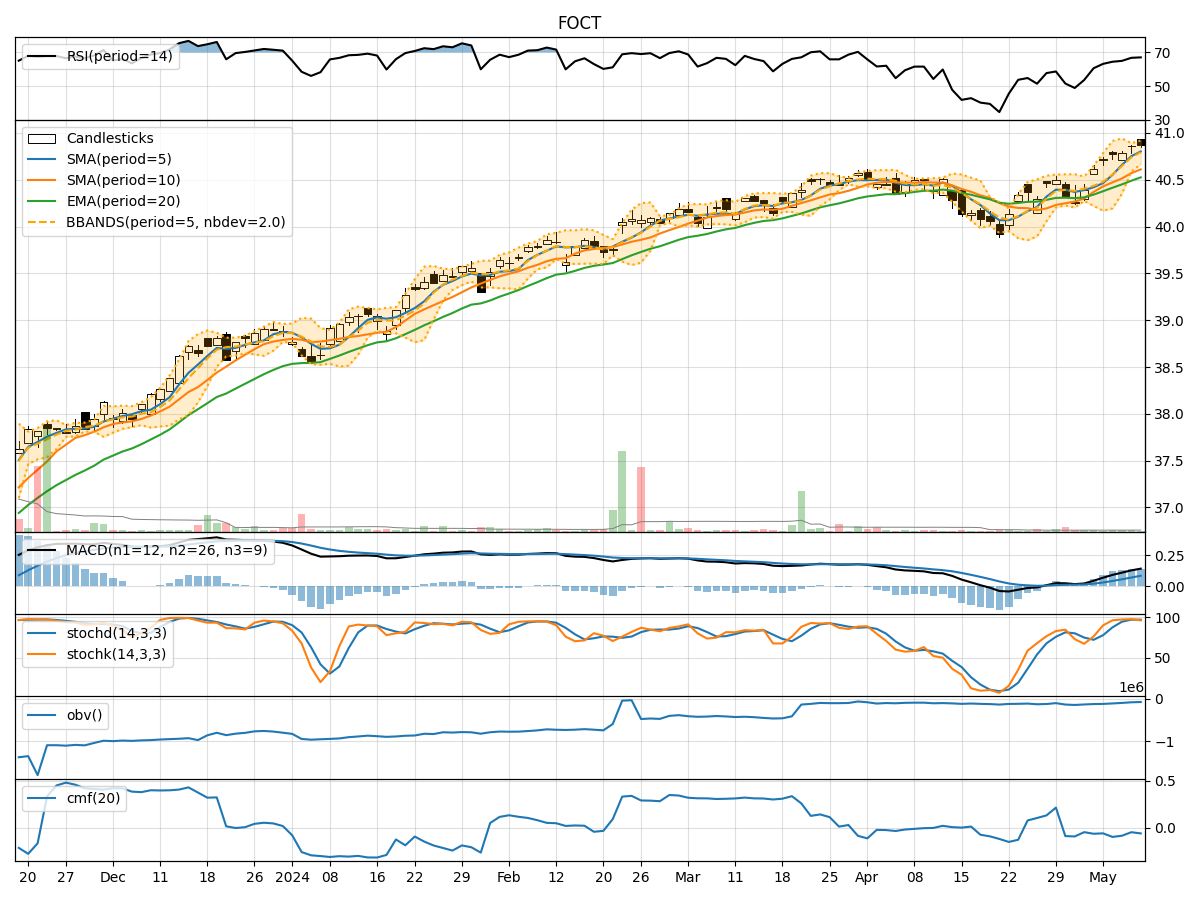
Technical Analysis of FOCT 2024-05-10
Overview:
In analyzing the technical indicators for FOCT over the last 5 days, we will delve into the trend, momentum, volatility, and volume indicators to provide a comprehensive outlook on the possible stock price movement in the coming days. By examining these key indicators, we aim to offer valuable insights and predictions for potential investors.
Trend Indicators:
- Moving Averages (MA): The 5-day Moving Average has been consistently above the closing prices, indicating a bullish trend.
- MACD: The MACD line has been steadily increasing, with the MACD histogram also showing positive values, suggesting a strengthening bullish momentum.
- EMA: The Exponential Moving Average has been trending upwards, supporting the bullish sentiment in the short term.
Momentum Indicators:
- RSI: The Relative Strength Index has been in the overbought territory, indicating a strong buying momentum.
- Stochastic Oscillator: Both %K and %D have been in the overbought zone, signaling a potential reversal or consolidation.
- Williams %R: The Williams %R has been fluctuating in the oversold and overbought regions, suggesting a mixed sentiment among traders.
Volatility Indicators:
- Bollinger Bands: The price has been trading within the upper Bollinger Band, indicating an overbought condition.
- Bollinger %B: The %B indicator has been hovering around 0.8, suggesting a high volatility environment.
- Bollinger Band Width: The Band Width has been narrowing, indicating a potential decrease in volatility.
Volume Indicators:
- On-Balance Volume (OBV): The OBV has shown a slight increase, indicating some accumulation by investors.
- Chaikin Money Flow (CMF): The CMF has been negative, suggesting a net outflow of money from the stock.
Key Observations:
- The trend indicators point towards a bullish sentiment in the short term, supported by moving averages and MACD.
- Momentum indicators show a strong buying momentum but also hint at potential overbought conditions.
- Volatility indicators suggest a high volatility environment, with Bollinger Bands signaling an overbought scenario.
- Volume indicators reflect mixed signals, with OBV showing slight accumulation but CMF indicating a net outflow of money.
Conclusion:
Based on the analysis of the technical indicators, the next few days' possible stock price movement for FOCT is likely to be sideways to slightly bearish. While the trend indicators support a bullish view, the overbought conditions indicated by momentum indicators and high volatility levels suggest a potential pullback or consolidation in the near term. Investors should closely monitor key support and resistance levels for potential entry or exit points.