Technical Analysis of FORH 2024-05-10
Overview:
In analyzing the technical indicators for FORH over the last 5 days, we will delve into the trend, momentum, volatility, and volume indicators to provide a comprehensive outlook on the possible stock price movement in the coming days. By examining these key aspects, we aim to offer valuable insights and recommendations for potential investors.
Trend Analysis:
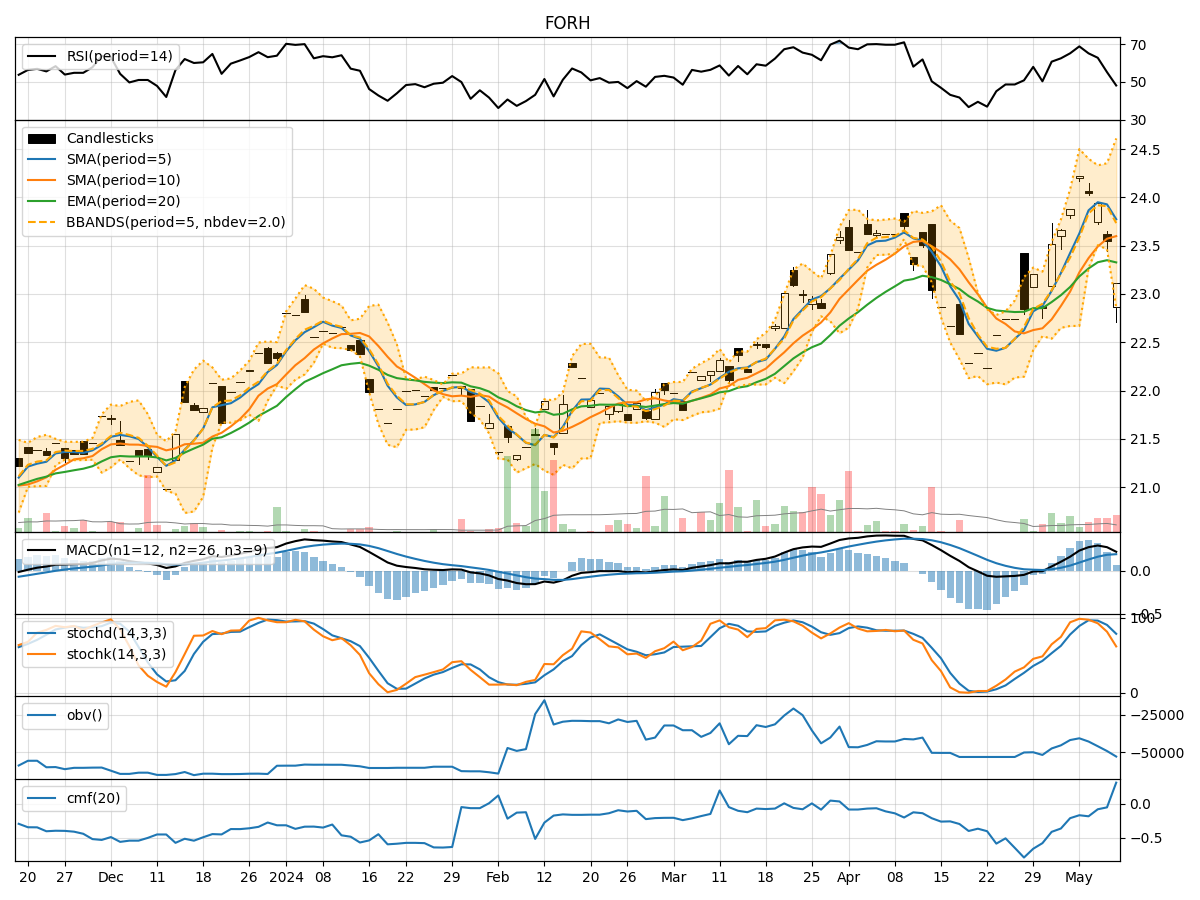
- Moving Averages (MA): The 5-day Moving Average (MA) has been fluctuating around the closing prices, indicating short-term price trends.
- MACD: The Moving Average Convergence Divergence (MACD) has shown positive values, suggesting a bullish momentum in the stock.
- EMA: The Exponential Moving Average (EMA) has been relatively stable, reflecting a consistent price trend.
Key Observation: The trend indicators suggest a bullish sentiment in the short term.
Momentum Analysis:
- RSI: The Relative Strength Index (RSI) has been declining, indicating a weakening momentum.
- Stochastic Oscillator: Both %K and %D have been decreasing, signaling a potential reversal in momentum.
- Williams %R: The Williams %R is in oversold territory, suggesting a possible upcoming price correction.
Key Observation: The momentum indicators point towards a bearish outlook in the near future.
Volatility Analysis:
- Bollinger Bands: The Bollinger Bands have been narrowing, indicating decreasing volatility.
- Bollinger %B: The %B indicator has been hovering around the middle range, suggesting a balanced volatility level.
Key Observation: Volatility is currently low, indicating a potential period of consolidation or sideways movement.
Volume Analysis:
- On-Balance Volume (OBV): The OBV has been fluctuating, reflecting mixed buying and selling pressure.
- Chaikin Money Flow (CMF): The CMF has been negative, indicating a net outflow of money from the stock.
Key Observation: Volume indicators suggest a neutral stance with no clear direction.
Conclusion:
Based on the analysis of the trend, momentum, volatility, and volume indicators, the next few days for FORH stock are likely to see a sideways movement with a bearish bias in momentum. The low volatility and mixed volume signals further support the expectation of a consolidation phase.
Key Conclusion: The overall outlook for FORH in the next few days leans towards a sideways trend with a bearish bias. Investors should exercise caution and closely monitor the price action for potential entry or exit points.