Technical Analysis of FPA 2024-05-10
Overview:
In analyzing the provided Technical Analysis (TA) data for the last 5 days of FPA stock, we will delve into the trend, momentum, volatility, and volume indicators to derive insights into the possible future stock price movement. By examining these key indicators, we aim to provide a comprehensive analysis and make informed predictions for the upcoming days.
Trend Analysis:
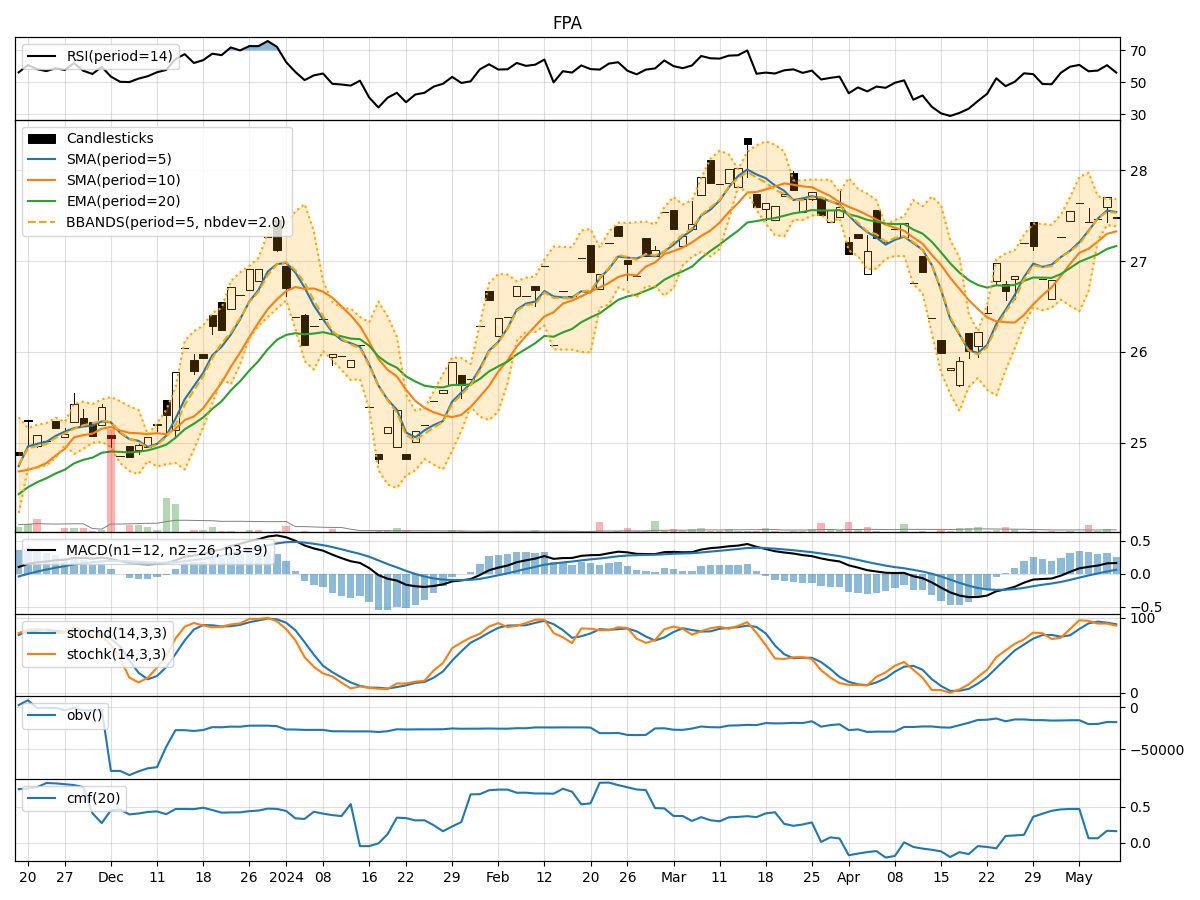
- Moving Averages (MA): The 5-day Moving Average (MA) has been consistently above the Simple Moving Average (SMA) and Exponential Moving Average (EMA) over the past 5 days, indicating a bullish trend.
- MACD: The Moving Average Convergence Divergence (MACD) has shown positive values, with the MACD line consistently above the Signal line, suggesting bullish momentum in the stock price.
Momentum Analysis:
- RSI: The Relative Strength Index (RSI) has been fluctuating around the 50 level, indicating neutral momentum in the stock.
- Stochastic Oscillator: Both %K and %D lines of the Stochastic Oscillator have been hovering around the overbought zone, suggesting a potential reversal in the stock price.
Volatility Analysis:
- Bollinger Bands (BB): The stock price has mostly remained within the Bollinger Bands, with the bands narrowing, indicating low volatility in the stock.
Volume Analysis:
- On-Balance Volume (OBV): The OBV has shown mixed movements, indicating indecisiveness among investors regarding the stock.
- Chaikin Money Flow (CMF): The CMF has been positive but relatively flat, suggesting neutral buying pressure in the stock.
Key Observations:
- The trend indicators suggest a bullish bias in the stock price, supported by positive MACD values.
- Momentum indicators show mixed signals, with RSI indicating neutrality and Stochastic Oscillator hinting at a potential reversal.
- Volatility remains low, as depicted by the narrowing Bollinger Bands.
- Volume indicators reflect indecisiveness among investors, with OBV showing mixed movements and CMF indicating neutral buying pressure.
Conclusion:
Based on the analysis of the technical indicators, the next few days' possible stock price movement for FPA stock is likely to be upward. The bullish trend indicated by moving averages and MACD, coupled with low volatility, suggests a potential for price appreciation. However, investors should remain cautious due to mixed signals from momentum indicators and indecisiveness in volume movements. It is advisable to closely monitor the stock's price action and key technical levels for confirmation of the upward trend.
Recommendation:
Considering the overall analysis, investors may consider buying FPA stock in the short term, with a focus on monitoring key technical levels and potential reversal signals from momentum indicators. It is essential to set appropriate stop-loss levels to manage risk effectively and capitalize on the potential upward movement in the stock price.