Technical Analysis of FPE 2024-05-10
Overview:
In analyzing the technical indicators for FPE stock over the last 5 days, we will delve into the trend, momentum, volatility, and volume indicators to provide a comprehensive outlook on the possible stock price movement in the coming days. By examining these key indicators, we aim to offer valuable insights and predictions for potential investors.
Trend Analysis:
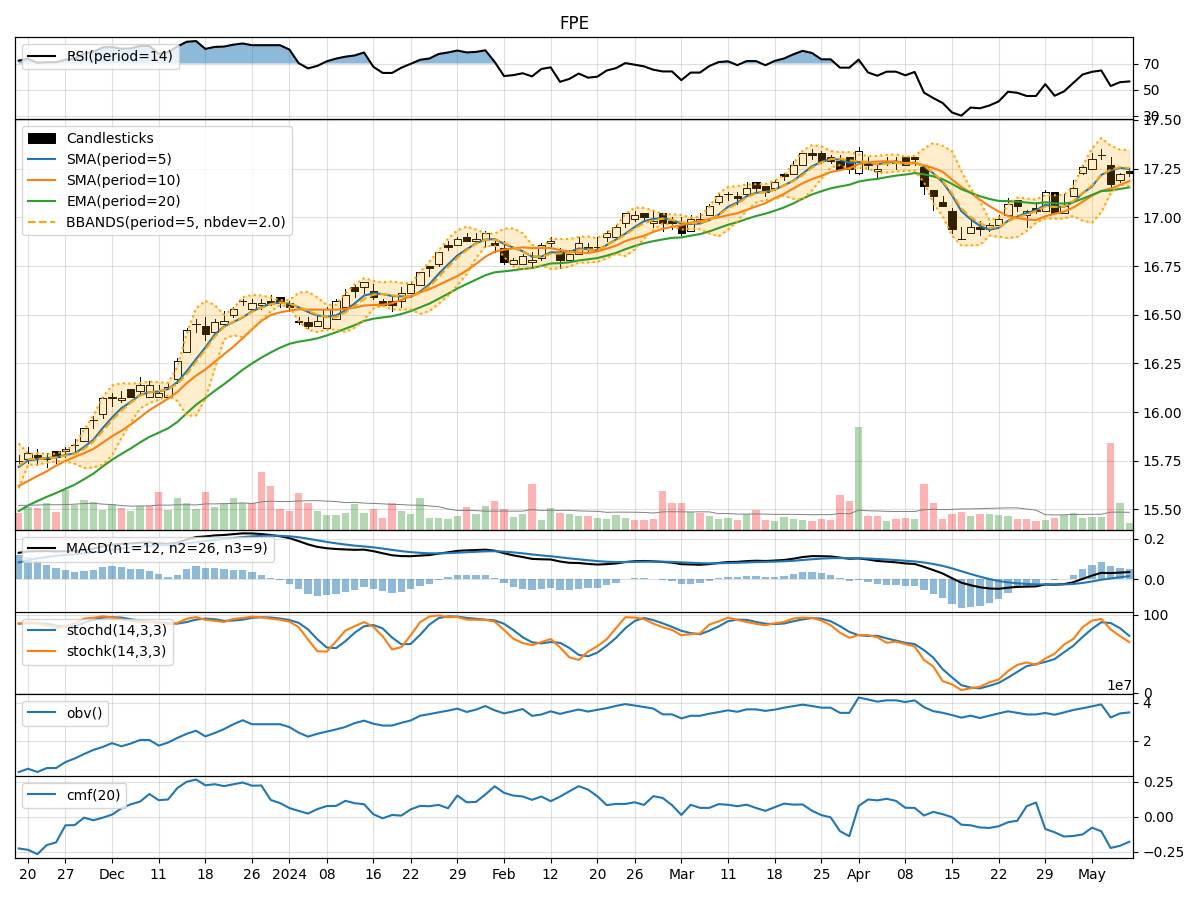
- Moving Averages (MA): The 5-day Moving Average (MA) has been consistently above the Simple Moving Average (SMA) and Exponential Moving Average (EMA), indicating a short-term bullish trend.
- MACD: The MACD line has been consistently above the signal line, with both lines showing an upward trend, suggesting bullish momentum.
- MACD Histogram: The MACD Histogram has been increasing over the past 5 days, indicating strengthening bullish momentum.
Momentum Analysis:
- RSI: The Relative Strength Index (RSI) has been fluctuating around the 50 level, indicating a neutral momentum in the stock.
- Stochastic Oscillator: Both %K and %D lines of the Stochastic Oscillator have been declining, suggesting a potential reversal in momentum.
- Williams %R: The Williams %R indicator has been hovering in the oversold territory, indicating a possible buying opportunity.
Volatility Analysis:
- Bollinger Bands: The stock price has been trading within the Bollinger Bands, with the bands narrowing, indicating decreasing volatility.
- Bollinger %B: The %B indicator has been fluctuating around the midline, suggesting a lack of clear direction in volatility.
Volume Analysis:
- On-Balance Volume (OBV): The OBV indicator has been fluctuating, indicating mixed buying and selling pressure.
- Chaikin Money Flow (CMF): The CMF has been negative, suggesting a bearish money flow in the stock.
Conclusion:
Based on the analysis of the technical indicators, the stock is currently in a consolidation phase with neutral momentum and decreasing volatility. The trend indicators suggest a short-term bullish bias, while the momentum indicators point towards a potential reversal in momentum. The volume indicators indicate mixed buying and selling pressure.
Forecast:
Given the current market conditions and the technical indicators, the stock price of FPE is likely to experience sideways movement in the coming days. Investors should closely monitor key support and resistance levels for potential breakout opportunities. It is advisable to wait for more clarity in the market direction before making significant trading decisions.