Technical Analysis of FPEI 2024-05-10
Overview:
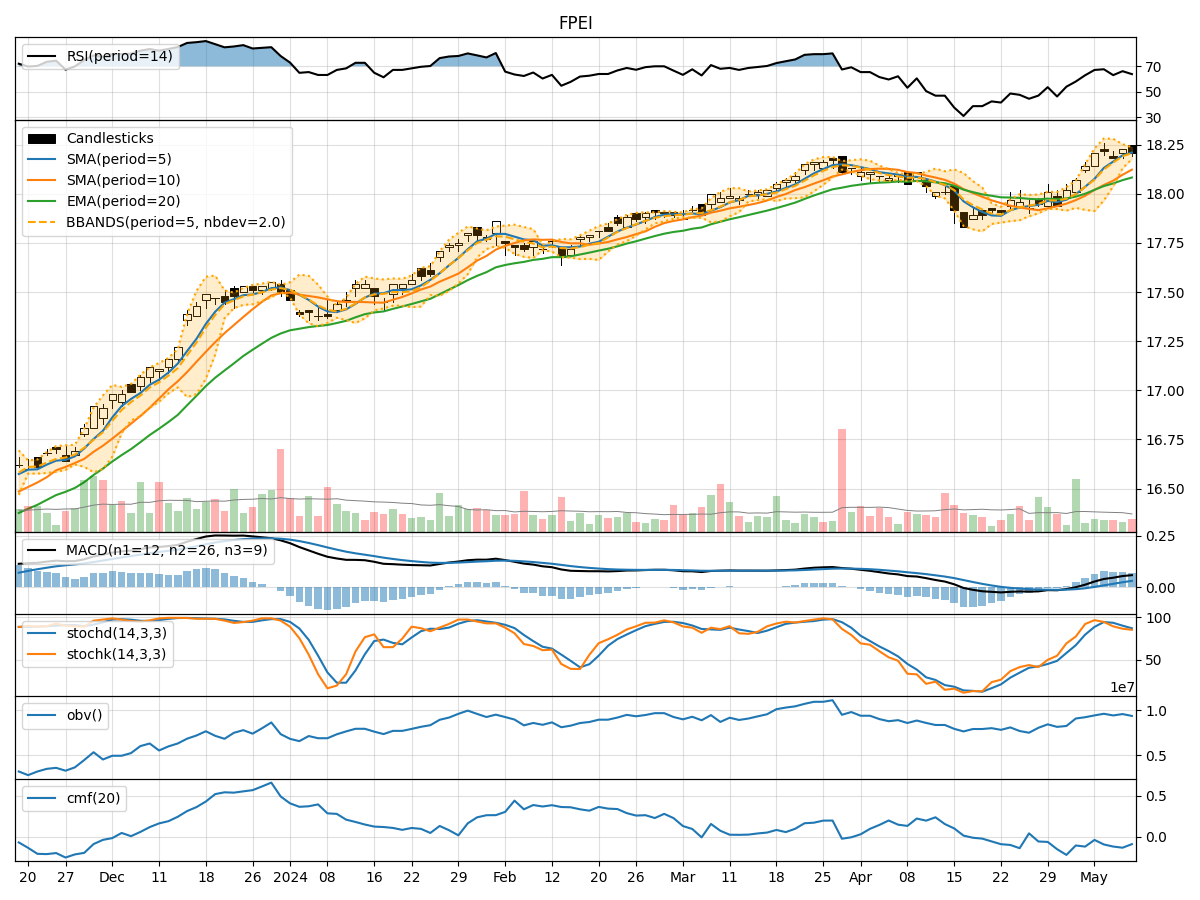
In analyzing the technical indicators for FPEI over the last 5 days, we will delve into the trend, momentum, volatility, and volume indicators to provide a comprehensive outlook on the possible stock price movement in the coming days. By examining these key aspects, we aim to offer valuable insights and predictions for potential investors.
Trend Indicators:
- Moving Averages (MA): The 5-day MA has been consistently above the closing prices, indicating a short-term uptrend.
- MACD: The MACD line has been positive and increasing, suggesting bullish momentum.
- RSI: The RSI values have been fluctuating around the overbought territory, indicating strong buying pressure.
Momentum Indicators:
- Stochastic Oscillator: Both %K and %D have been declining but remain in the overbought zone, signaling a potential reversal.
- Williams %R: The indicator has been hovering in the oversold region, suggesting a possible buying opportunity.
Volatility Indicators:
- Bollinger Bands (BB): The stock price has been trading within the bands, indicating a period of consolidation.
- BB Percentage (BBP): The BBP values have been fluctuating around 0.5, reflecting a balanced market sentiment.
Volume Indicators:
- On-Balance Volume (OBV): The OBV has been fluctuating, indicating indecision among investors.
- Chaikin Money Flow (CMF): The CMF has been negative, suggesting outflow of money from the stock.
Key Observations:
- The trend indicators suggest a bullish sentiment in the short term.
- Momentum indicators show signs of potential reversal or consolidation.
- Volatility indicators point towards a period of sideways movement.
- Volume indicators reflect uncertainty and lack of strong buying interest.
Conclusion:
Based on the analysis of the technical indicators, the next few days for FPEI stock price movement could be sideways with a slight bearish bias. While the trend indicators indicate a bullish outlook, the momentum indicators suggest a possible reversal or consolidation. The volatility indicators point towards a sideways market, and the volume indicators reflect a lack of strong buying interest. Therefore, investors should exercise caution and closely monitor the price action for any potential shifts in market sentiment.