Technical Analysis of FPFD 2024-05-10
Overview:
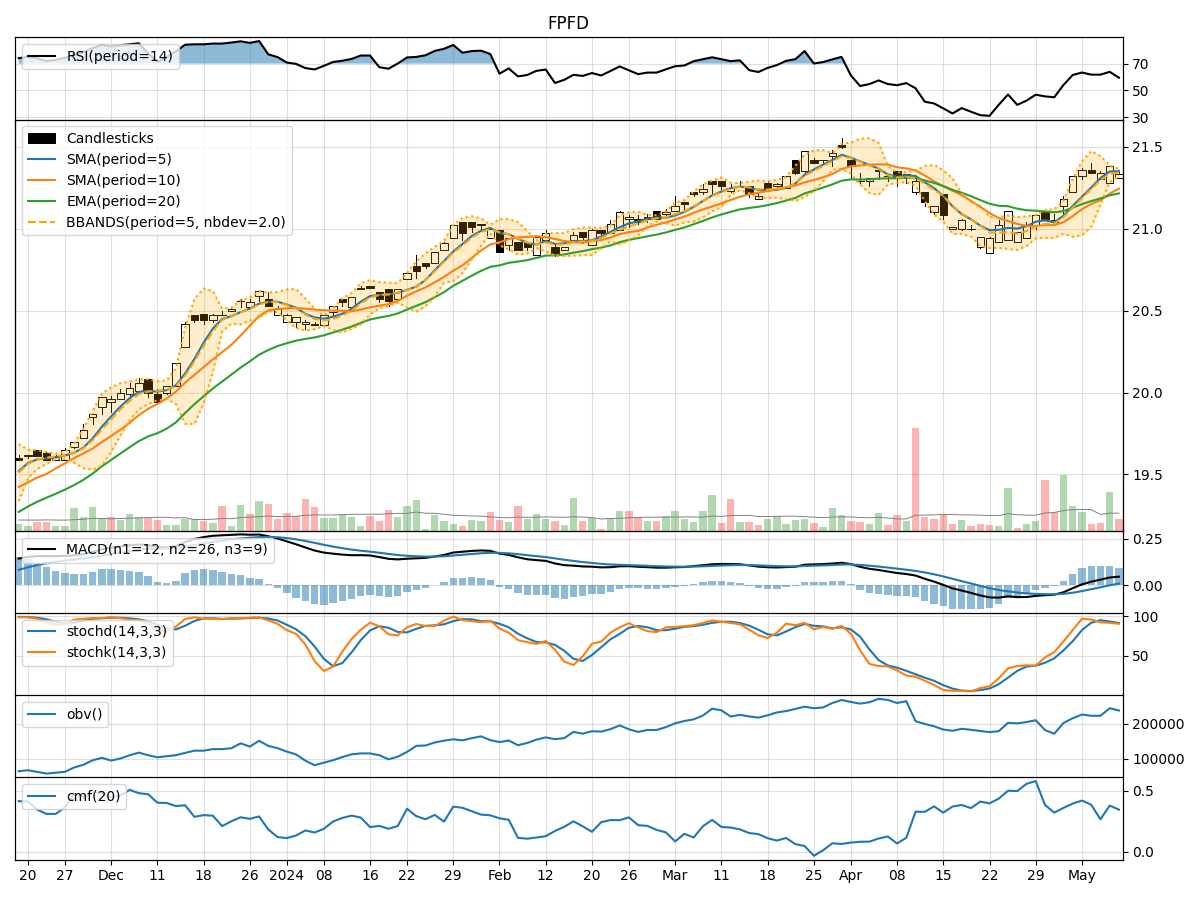
In analyzing the technical indicators for FPFD over the last 5 days, we will delve into the trend, momentum, volatility, and volume indicators to provide a comprehensive outlook on the possible stock price movement in the coming days.
Trend Analysis:
- Moving Averages (MA): The 5-day Moving Average (MA) has been consistently above the Simple Moving Average (SMA) and Exponential Moving Average (EMA), indicating a bullish trend.
- MACD: The MACD line has been consistently above the signal line, with the MACD Histogram showing positive values, further supporting the bullish trend.
Momentum Analysis:
- RSI: The Relative Strength Index (RSI) has been fluctuating around the 60-70 range, suggesting a neutral momentum.
- Stochastic Oscillator: Both %K and %D have been hovering around the overbought territory, indicating a potential reversal or consolidation.
Volatility Analysis:
- Bollinger Bands (BB): The stock price has been trading within the Bollinger Bands, with the bands narrowing, indicating decreasing volatility.
- Bollinger %B: The %B indicator has been fluctuating around the midline, suggesting a lack of clear direction in price movement.
Volume Analysis:
- On-Balance Volume (OBV): The OBV has shown mixed signals, with no clear trend in volume accumulation or distribution.
- Chaikin Money Flow (CMF): The CMF has been fluctuating around the neutral zone, indicating a balance between buying and selling pressure.
Conclusion:
Based on the analysis of the technical indicators, the stock of FPFD is currently in a consolidation phase with neutral momentum and decreasing volatility. The trend remains bullish based on moving averages and MACD, but the overbought signals from the Stochastic Oscillator suggest a potential reversal or sideways movement in the short term.
Recommendation:
Considering the mixed signals from the indicators, it is advisable for investors to exercise caution and closely monitor the price action. Short-term traders may consider taking profits or setting tight stop-loss orders, while long-term investors could use any potential pullback as a buying opportunity in line with the overall bullish trend.
Disclaimer:
It is important to note that technical analysis is not a guaranteed predictor of future price movements, and other fundamental factors can influence stock prices. It is recommended to conduct thorough research and consider multiple indicators before making any investment decisions. Consulting with a financial advisor is also advisable to tailor strategies to individual investment goals and risk tolerance levels.