Technical Analysis of FPRO 2024-05-10
Overview:
In analyzing the technical indicators for FPRO over the last 5 days, we will delve into the trend, momentum, volatility, and volume indicators to provide a comprehensive outlook on the possible stock price movement in the coming days. By examining these key aspects, we aim to offer valuable insights and predictions for potential investors.
Trend Indicators:
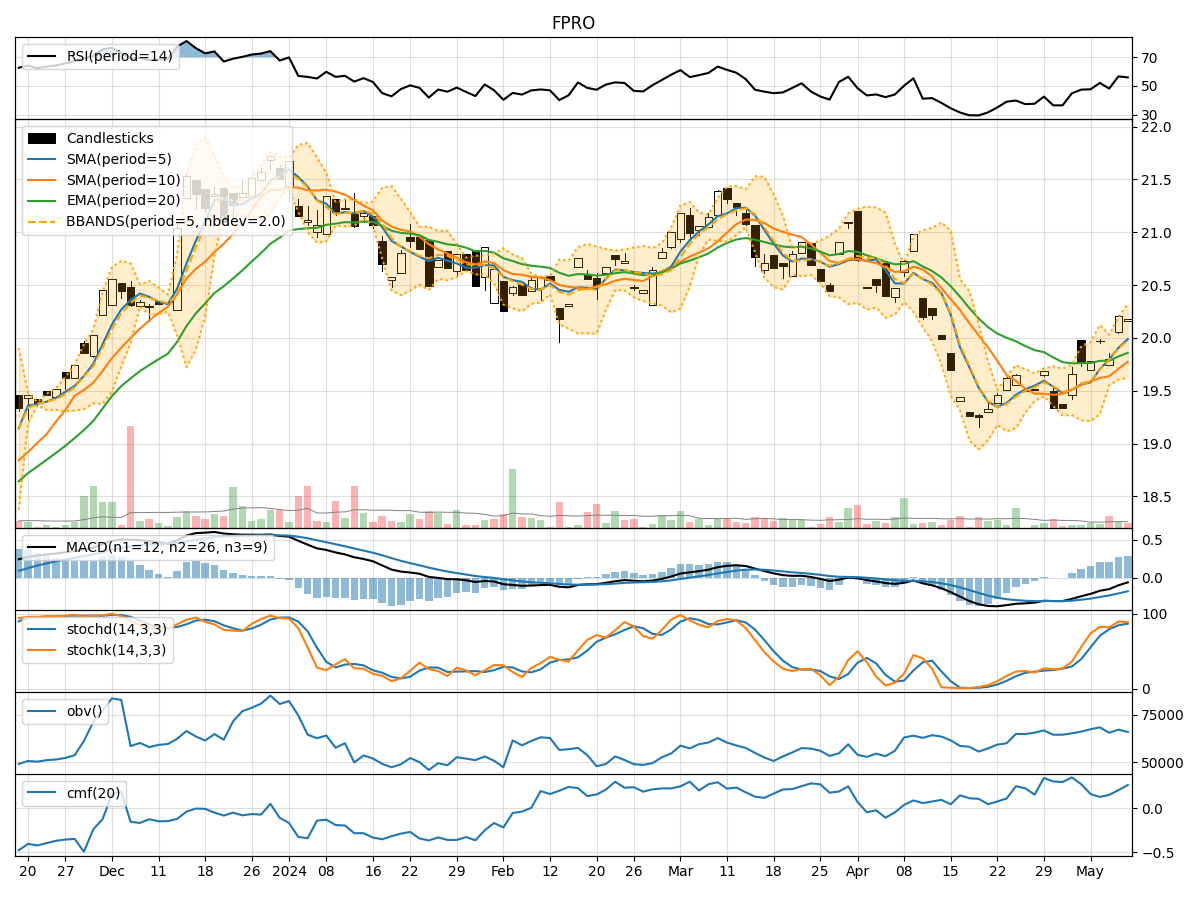
- Moving Averages (MA): The 5-day MA has been consistently above the closing prices, indicating a short-term uptrend.
- MACD: The MACD line has been negative but showing signs of convergence with the signal line, suggesting a potential reversal.
- RSI: The RSI values have been fluctuating around the neutral zone, indicating a lack of strong trend direction.
Momentum Indicators:
- Stochastic Oscillator: Both %K and %D values have been in overbought territory, signaling a potential reversal or consolidation.
- Williams %R: The indicator has been hovering near oversold levels, suggesting a possible buying opportunity.
Volatility Indicators:
- Bollinger Bands (BB): The bands have been relatively narrow, indicating low volatility and a potential breakout in either direction.
- BB %B: The %B values have been fluctuating around the midline, reflecting uncertainty in the market direction.
Volume Indicators:
- On-Balance Volume (OBV): The OBV has shown mixed signals, reflecting indecision among market participants.
- Chaikin Money Flow (CMF): The CMF values have been positive, indicating buying pressure in the market.
Key Observations:
- The trend indicators suggest a potential reversal or consolidation in the short term.
- Momentum indicators point towards a possible shift in momentum from overbought to oversold levels.
- Volatility indicators indicate a period of low volatility, potentially preceding a significant price movement.
- Volume indicators reflect mixed signals, with buying pressure but indecision among investors.
Conclusion:
Based on the analysis of the technical indicators, the next few days for FPRO could see sideways movement with a potential for a breakout in either direction. Traders should closely monitor key levels such as support and resistance to capitalize on potential price swings. Exercise caution and wait for confirmation from multiple indicators before making trading decisions.