Technical Analysis of FPX 2024-05-10
Overview:
In analyzing the technical indicators for FPX over the last 5 days, we will delve into the trend, momentum, volatility, and volume indicators to provide a comprehensive outlook on the possible stock price movement in the coming days. By examining these key indicators, we aim to offer valuable insights and recommendations for potential investors.
Trend Indicators:
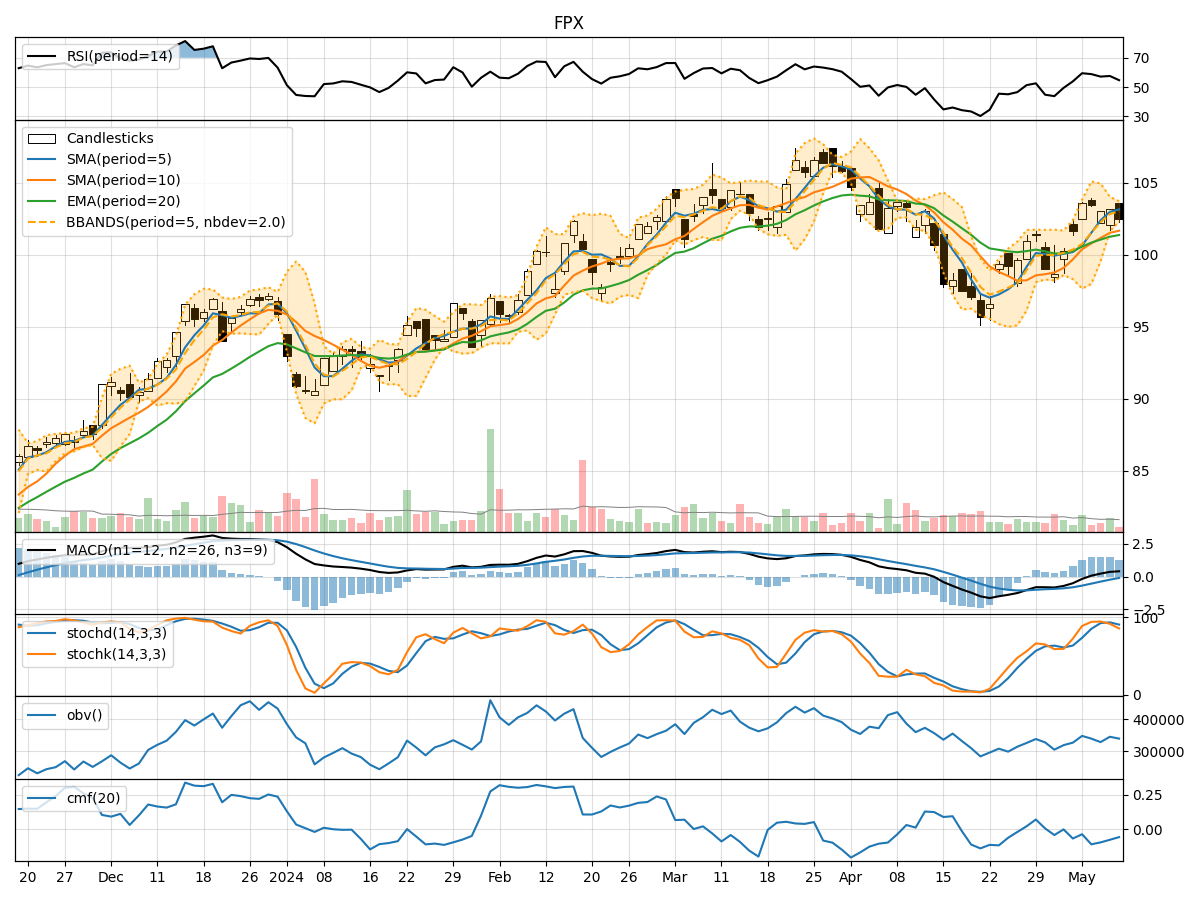
- Moving Averages (MA): The 5-day MA has been consistently above the closing prices, indicating a bullish trend.
- MACD: The MACD line has been above the signal line, suggesting a bullish momentum.
- EMA: The EMA has been trending upwards, supporting the bullish sentiment.
Momentum Indicators:
- RSI: The RSI has been fluctuating around the neutral zone, indicating indecision in the market.
- Stochastic Oscillator: Both %K and %D have been declining, signaling a potential bearish momentum.
- Williams %R: The indicator has been in the oversold territory, suggesting a possible reversal.
Volatility Indicators:
- Bollinger Bands (BB): The bands have been narrowing, indicating decreasing volatility.
- BB %B: The %B has been hovering around the middle, reflecting a neutral stance.
Volume Indicators:
- On-Balance Volume (OBV): The OBV has been declining, indicating selling pressure.
- Chaikin Money Flow (CMF): The CMF has been negative, suggesting outflow of money from the stock.
Key Observations:
- The trend indicators point towards a bullish sentiment, supported by moving averages and MACD.
- Momentum indicators show a mixed signal with RSI indicating neutrality and stochastic oscillators hinting at a bearish bias.
- Volatility has been decreasing, indicating a possible consolidation phase.
- Volume indicators suggest a bearish outlook with declining OBV and negative CMF.
Conclusion:
Based on the analysis of the technical indicators, the next few days for FPX stock price movement are likely to be sideways with a slight bearish bias. Investors should exercise caution and closely monitor the price action for any potential reversal signals. It is advisable to wait for more clarity in the market dynamics before making any significant trading decisions.