Technical Analysis of FPXE 2024-05-10
Overview:
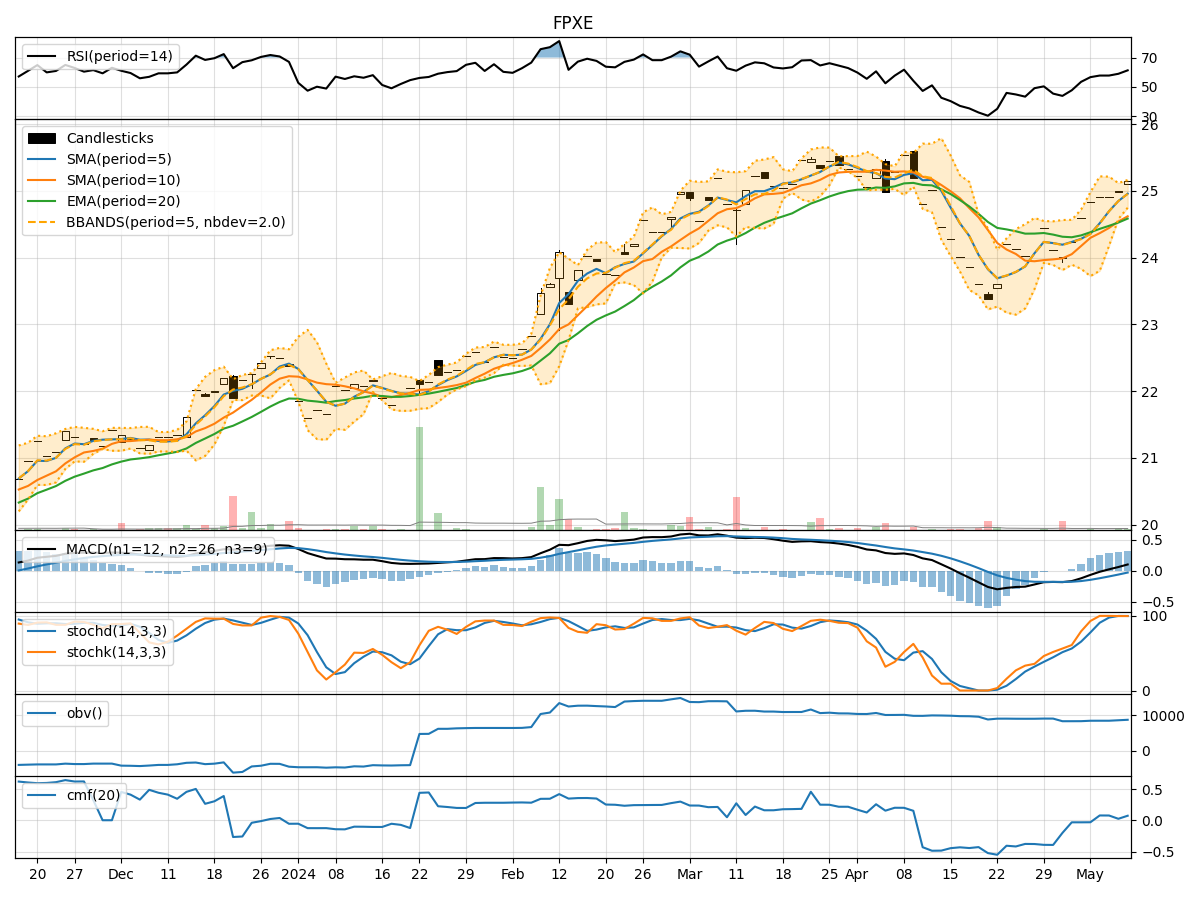
In analyzing the technical indicators for the stock FPXE over the last 5 days, we will delve into the trends, momentum, volatility, and volume aspects to provide a comprehensive outlook on the possible stock price movement in the coming days. By examining key indicators such as moving averages, MACD, RSI, Bollinger Bands, and OBV, we aim to offer valuable insights and predictions for potential price action.
Trend Analysis:
- Moving Averages (MA): The 5-day MA has been consistently above the 10-day SMA, indicating a short-term bullish trend.
- MACD: The MACD line has been above the signal line for the past 5 days, with the MACD histogram showing an increasing positive trend, suggesting bullish momentum.
Momentum Analysis:
- RSI: The RSI has been gradually increasing and is currently in the overbought territory, signaling strong buying momentum.
- Stochastic Oscillator: Both %K and %D have been consistently high, indicating strong upward momentum.
Volatility Analysis:
- Bollinger Bands (BB): The stock price has been trading within the upper Bollinger Band, suggesting high volatility and potential overbought conditions.
Volume Analysis:
- On-Balance Volume (OBV): The OBV has been steadily increasing over the last 5 days, indicating strong buying pressure.
Key Observations:
- The stock is exhibiting strong bullish trends across various indicators, with momentum indicators signaling overbought conditions.
- Volatility is high, as indicated by the upper Bollinger Band, which may lead to a potential pullback or consolidation.
- Increasing OBV suggests that buying pressure is robust and supports the bullish outlook.
Conclusion:
Based on the analysis of the technical indicators, the stock FPXE is likely to experience a continuation of the upward trend in the coming days. However, caution is advised due to the overbought conditions highlighted by the momentum indicators and high volatility. Traders should closely monitor price action for signs of a potential pullback or consolidation before considering entry points. Overall, the outlook remains bullish in the short term, but a healthy correction may be on the horizon.