Technical Analysis of FPXI 2024-05-10
Overview:
In analyzing the technical indicators for FPXI over the last 5 days, we will delve into the trend, momentum, volatility, and volume indicators to provide a comprehensive outlook on the possible stock price movement in the coming days. By examining these key indicators, we aim to offer valuable insights and predictions for potential investors.
Trend Analysis:
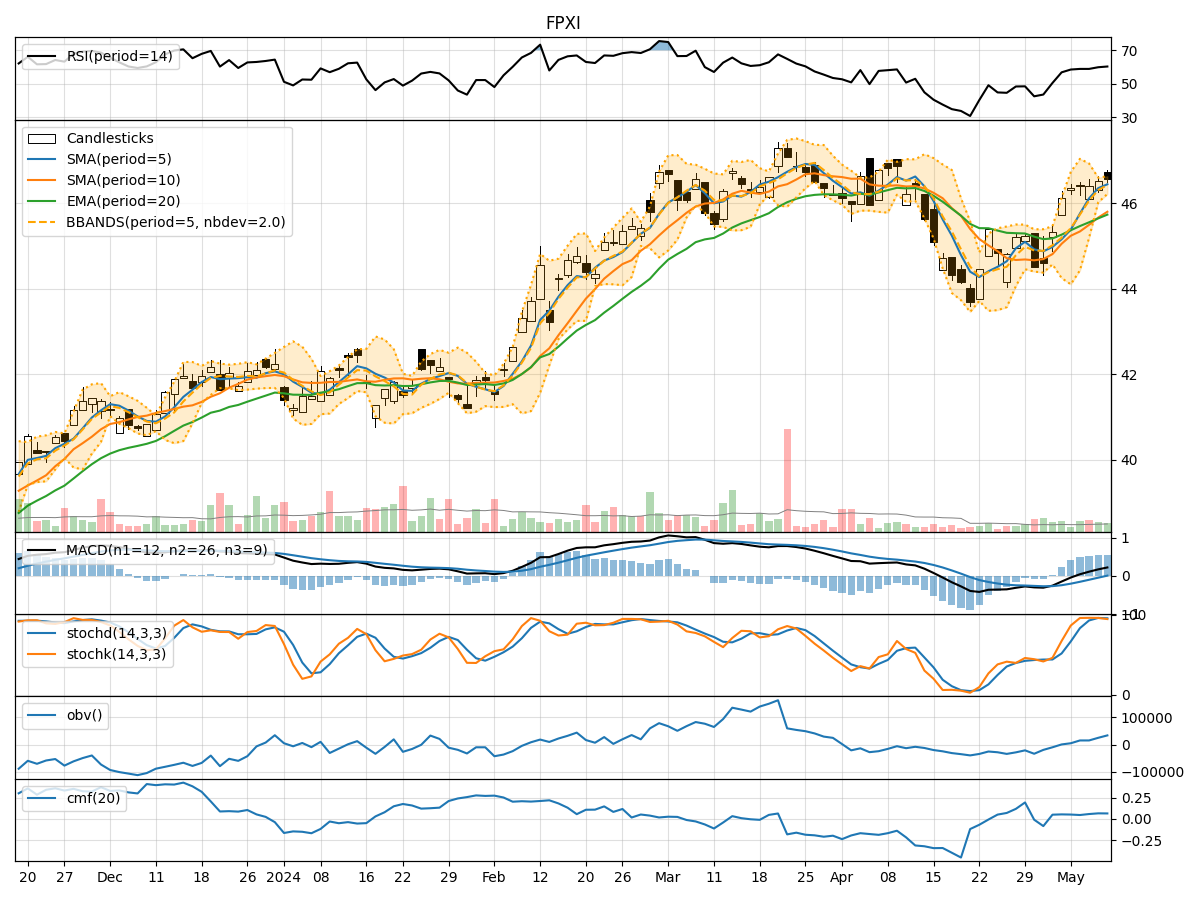
- Moving Averages (MA): The moving averages have been showing a consistent uptrend over the last 5 days, with the 5-day MA consistently above the longer-term SMAs and EMAs. This indicates a positive trend in the stock price.
- MACD: The MACD line has been consistently above the signal line, indicating bullish momentum in the stock.
- RSI: The RSI has been trending upwards, indicating increasing buying pressure in the stock.
Key Observation: The trend indicators suggest a strong bullish sentiment in the stock.
Momentum Analysis:
- Stochastic Oscillator: The Stochastic Oscillator has been in the overbought territory, indicating a strong upward momentum in the stock.
- Williams %R (WillR): The Williams %R has been consistently in the oversold territory, suggesting a potential reversal in the stock price.
Key Observation: The momentum indicators point towards a continuation of the bullish momentum in the stock.
Volatility Analysis:
- Bollinger Bands (BB): The Bollinger Bands have been narrowing, indicating decreasing volatility in the stock price.
- BB% (BB Percentage): The BB% has been increasing, suggesting a potential breakout or significant price movement.
Key Observation: The volatility indicators signal a potential upcoming price movement, possibly a breakout.
Volume Analysis:
- On-Balance Volume (OBV): The OBV has been steadily increasing, indicating strong buying volume in the stock.
- Chaikin Money Flow (CMF): The CMF has been positive, reflecting buying pressure in the stock.
Key Observation: The volume indicators support the bullish sentiment in the stock, with increasing buying volume.
Conclusion:
Based on the analysis of the technical indicators, including the strong bullish trend, positive momentum, potential breakout in volatility, and increasing buying volume, the outlook for FPXI in the next few days is bullish. Investors may consider entering long positions or holding onto existing positions to capitalize on the expected upward movement in the stock price.
Key Conclusion: Bullish sentiment is dominant based on the technical analysis, suggesting a potential upward movement in FPXI in the coming days.