Technical Analysis of FRTY 2024-05-10
Overview:
In analyzing the technical indicators for FRTY over the last 5 days, we will delve into the trend, momentum, volatility, and volume indicators to provide a comprehensive outlook on the possible stock price movement in the coming days. By examining these key aspects, we aim to offer valuable insights and predictions to guide investment decisions.
Trend Analysis:
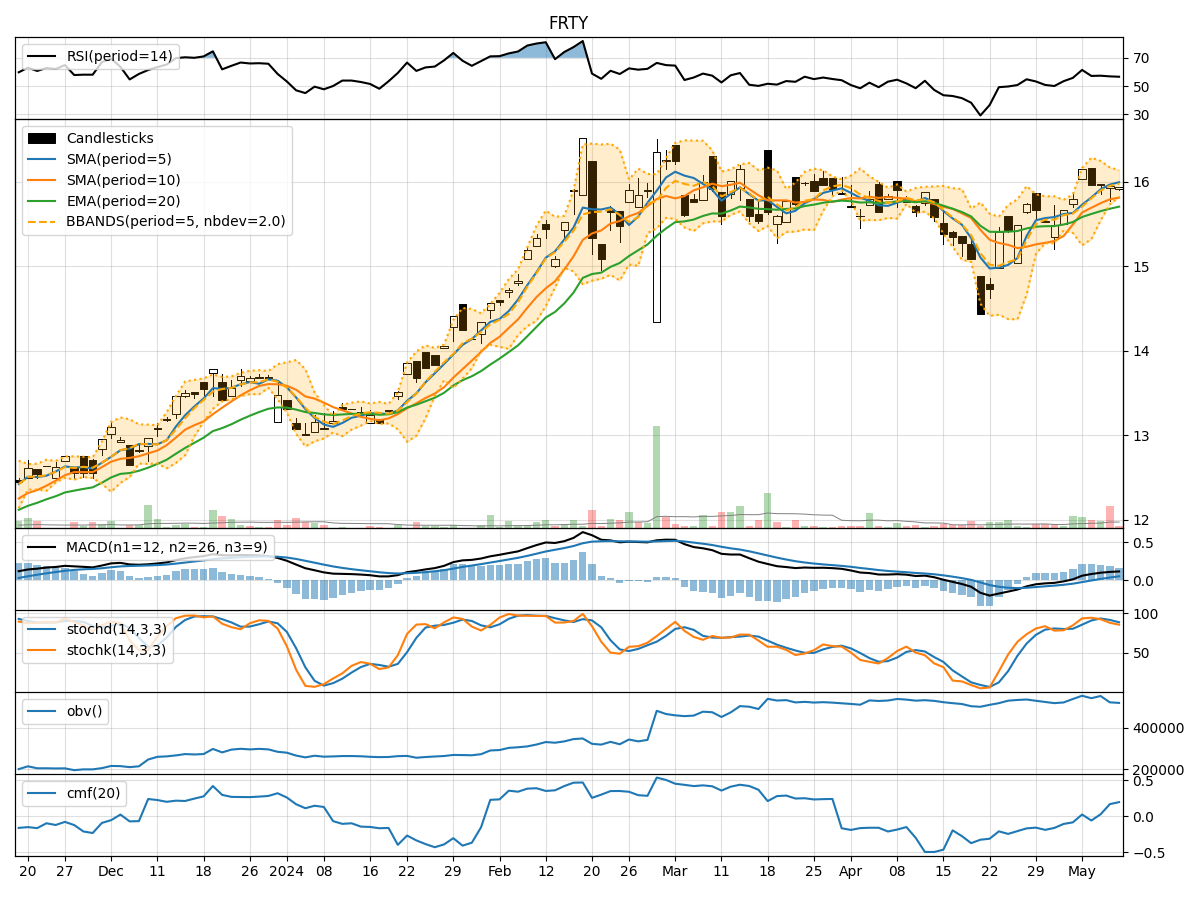
- Moving Averages (MA): The 5-day MA has been consistently above the closing prices, indicating a short-term uptrend.
- MACD: The MACD line has been above the signal line, suggesting bullish momentum.
- EMA: The EMA has been trending upwards, supporting the bullish sentiment.
Key Observation: The trend indicators point towards an upward trend in the stock price.
Momentum Analysis:
- RSI: The RSI has been fluctuating around the 50 level, indicating a neutral momentum.
- Stochastic Oscillator: Both %K and %D have been declining, signaling a potential reversal in momentum.
Key Observation: Momentum indicators suggest a neutral to slightly bearish momentum in the stock.
Volatility Analysis:
- Bollinger Bands (BB): The stock price has been trading within the bands, with the bands narrowing, indicating decreasing volatility.
- Bollinger %B: The %B has been hovering around 0.5, reflecting a balanced market sentiment.
Key Observation: Volatility indicators signal a consolidation phase with decreasing volatility.
Volume Analysis:
- On-Balance Volume (OBV): The OBV has been fluctuating, indicating mixed buying and selling pressure.
- Chaikin Money Flow (CMF): The CMF has been positive, suggesting inflow of money into the stock.
Key Observation: Volume indicators show a mixed sentiment with a slight bullish bias.
Conclusion:
Based on the analysis of the technical indicators, the stock of FRTY is likely to experience sideways movement in the coming days. The trend indicators support an upward bias, while momentum indicators suggest a neutral to slightly bearish sentiment. Volatility is decreasing, indicating a consolidation phase, and volume indicators show mixed signals with a slight bullish bias. Therefore, investors should expect the stock price to trade within a range with no clear directional bias in the near term.
Recommendation:
Given the current market dynamics, it is advisable for investors to closely monitor the stock price of FRTY for any breakout or reversal signals. Consider setting tight stop-loss levels to manage risk effectively in a sideways market environment. Additionally, conducting further analysis on broader market trends and company-specific developments can provide additional insights for making informed investment decisions.