Technical Analysis of FSBD 2024-05-10
Overview:
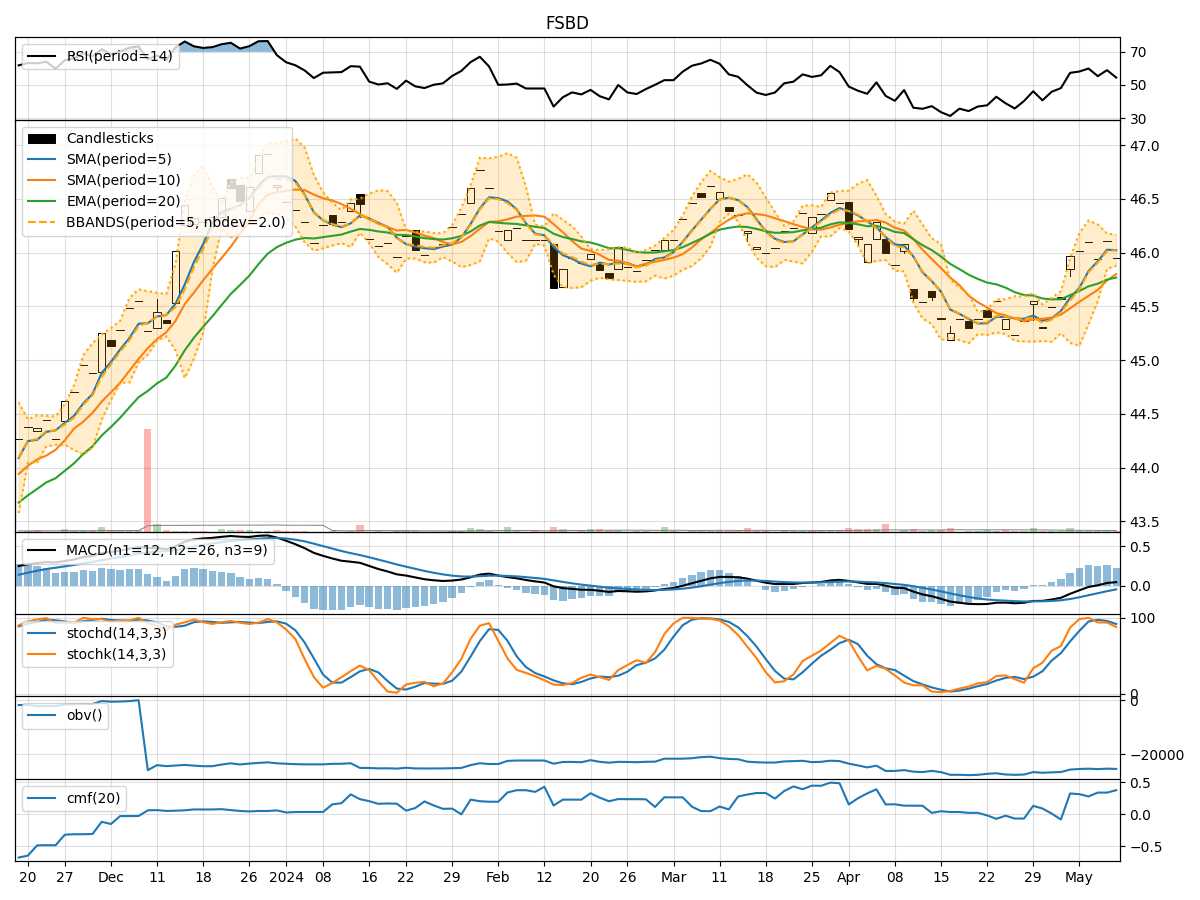
In analyzing the technical indicators for FSBD over the last 5 days, we will delve into the trend, momentum, volatility, and volume indicators to provide a comprehensive outlook on the possible stock price movement in the coming days. By examining these key aspects, we aim to offer valuable insights and predictions to guide investment decisions.
Trend Indicators:
- Moving Averages (MA): The 5-day MA has been consistently above the 10-day SMA, indicating a short-term bullish trend. The EMA(20) has shown a slight upward trend, suggesting positive momentum.
- MACD: The MACD line has been above the signal line, indicating a bullish trend. The MACD histogram has been mostly positive, supporting the bullish sentiment.
Momentum Indicators:
- RSI: The RSI has been fluctuating around the 50 level, indicating a neutral momentum in the stock.
- Stochastic Oscillator: The Stochastic indicators have shown overbought conditions, suggesting a potential reversal in the short term.
Volatility Indicators:
- Bollinger Bands (BB): The stock price has been trading within the Bollinger Bands, with the bands narrowing, indicating decreasing volatility.
- Bollinger %B (BBP): The %B indicator has been hovering around the midpoint, reflecting a neutral stance in terms of volatility.
Volume Indicators:
- On-Balance Volume (OBV): The OBV has shown mixed signals, with fluctuations in volume but no clear trend.
- Chaikin Money Flow (CMF): The CMF has been positive, indicating buying pressure in the stock.
Key Observations and Opinions:
- Trend: The trend indicators suggest a bullish sentiment in the short term, supported by moving averages and MACD.
- Momentum: The momentum indicators show a neutral stance, with the RSI around 50 and stochastic indicators signaling potential overbought conditions.
- Volatility: Volatility has been decreasing, as indicated by the narrowing Bollinger Bands, which could lead to a period of consolidation.
- Volume: Volume indicators show mixed signals, with no clear trend in volume accumulation.
Conclusion:
Based on the analysis of the technical indicators, the next few days for FSBD could see sideways movement with a slight bullish bias. Traders should watch for potential reversals indicated by the overbought conditions in the stochastic oscillator. The decreasing volatility suggests a period of consolidation, while the positive trend indicators point towards a potential upward movement in the stock price. It is advisable to closely monitor key support and resistance levels for confirmation of the anticipated price action.