Technical Analysis of FSEC 2024-05-10
Overview:
In analyzing the technical indicators for FSEC over the last 5 days, we will delve into the trend, momentum, volatility, and volume indicators to provide a comprehensive outlook on the possible stock price movement in the coming days. By examining these key aspects, we aim to offer valuable insights and predictions for potential investors and traders.
Trend Analysis:
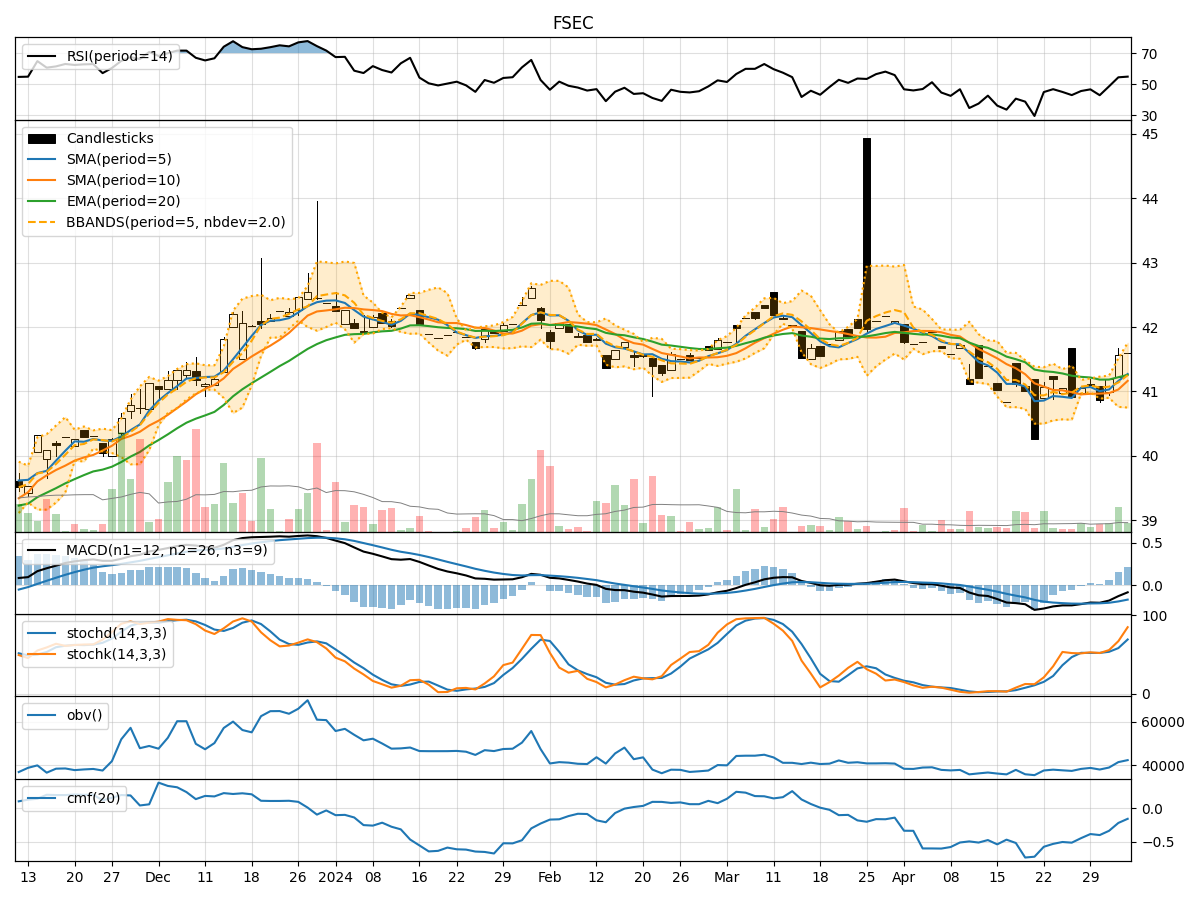
- Moving Averages (MA): The moving averages show a consistent uptrend over the last 5 days, with the closing price consistently above the short-term moving averages.
- MACD: The MACD line has been consistently positive, indicating a bullish trend.
- RSI: The RSI values have been fluctuating around the neutral zone, suggesting a balanced momentum.
Momentum Analysis:
- Stochastic Oscillator: The stochastic indicators have been fluctuating, indicating potential indecision in the market.
- Williams %R: The Williams %R values have been consistently in the oversold territory, signaling a possible reversal.
Volatility Analysis:
- Bollinger Bands: The Bollinger Bands have been relatively narrow, indicating low volatility in the stock price.
- BB% (Bollinger Band %B): The %B values have been hovering around the midpoint, suggesting a balanced market sentiment.
Volume Analysis:
- On-Balance Volume (OBV): The OBV values have shown mixed trends, indicating uncertainty in the buying and selling pressure.
- Chaikin Money Flow (CMF): The CMF values have been negative, reflecting a lack of strong buying interest.
Key Observations:
- The trend indicators suggest a bullish sentiment in the short term.
- Momentum indicators show mixed signals, with stochastic oscillators indicating potential indecision.
- Volatility remains low, indicating a stable price movement.
- Volume indicators reflect uncertainty in market participation.
Conclusion:
Based on the analysis of the technical indicators, the stock price of FSEC is likely to experience sideways consolidation in the coming days. While the trend indicators point towards a bullish sentiment, the mixed signals from momentum and volume indicators suggest a lack of strong conviction in the market. Additionally, the low volatility indicates a stable price movement without significant fluctuations. Therefore, investors should exercise caution and closely monitor the market dynamics before making any trading decisions.