Technical Analysis of FSEP 2024-05-10
Overview:
In analyzing the technical indicators for FSEP stock over the last 5 days, we will delve into the trend, momentum, volatility, and volume indicators to provide a comprehensive outlook on the possible stock price movement in the coming days. By examining these key indicators, we aim to offer valuable insights and predictions to guide your investment decisions.
Trend Analysis:
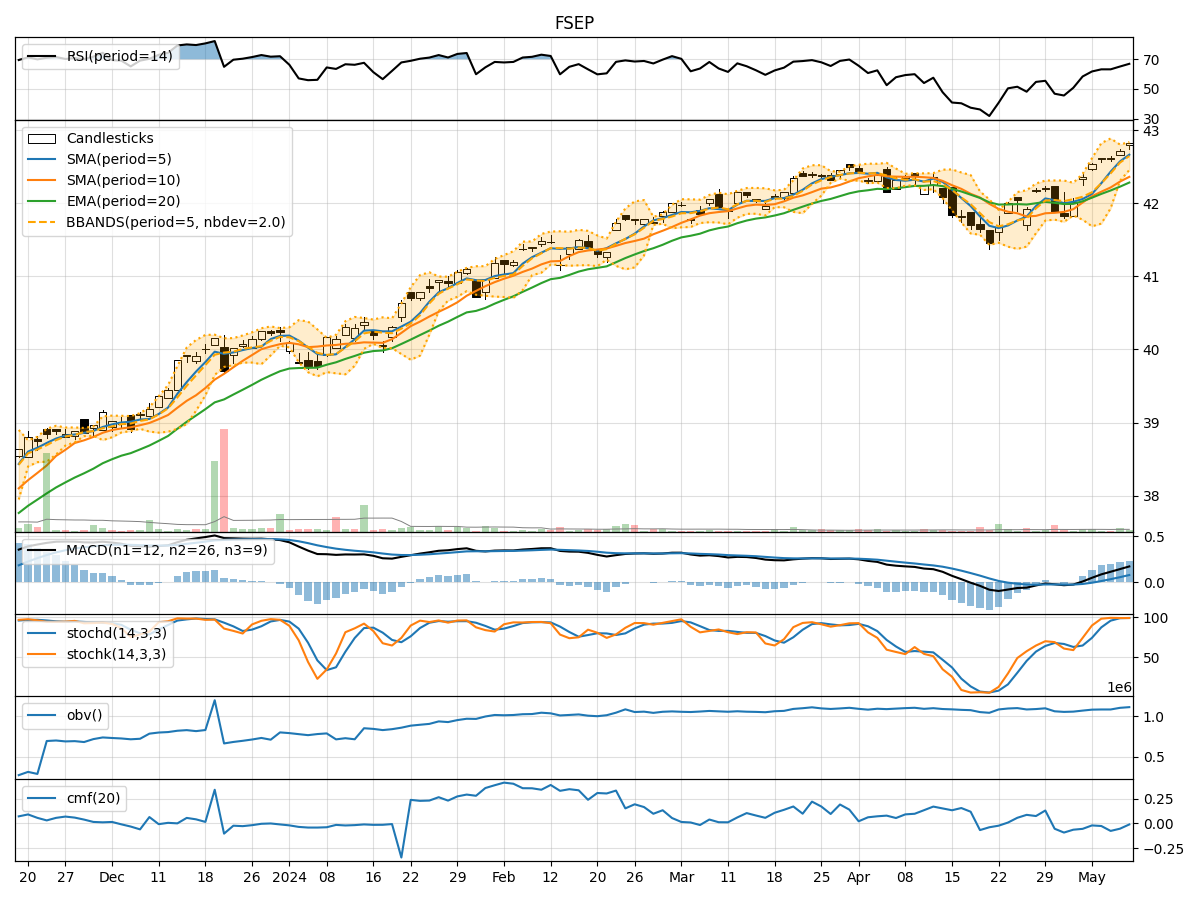
- Moving Averages (MA): The 5-day moving average has been consistently above the simple moving average (SMA) and exponential moving average (EMA), indicating a bullish trend.
- MACD: The MACD line has been consistently above the signal line, suggesting a bullish momentum in the stock price.
Key Observation: The trend indicators point towards a bullish sentiment in the stock price movement.
Momentum Analysis:
- RSI: The Relative Strength Index (RSI) has been trending upwards, indicating increasing buying pressure.
- Stochastic Oscillator: Both %K and %D have been consistently high, signaling strong positive momentum.
- Williams %R: The Williams %R is hovering around oversold levels, suggesting a potential reversal in the short term.
Key Observation: Momentum indicators reflect a bullish sentiment with room for potential price appreciation.
Volatility Analysis:
- Bollinger Bands: The stock price has been trading within the Bollinger Bands, with the bands narrowing, indicating decreasing volatility.
Key Observation: Volatility indicators suggest a consolidation phase in the stock price.
Volume Analysis:
- On-Balance Volume (OBV): The OBV has been fluctuating but has not shown a clear trend, indicating mixed buying and selling pressure.
- Chaikin Money Flow (CMF): The CMF has been negative, suggesting a slight outflow of money from the stock.
Key Observation: Volume indicators present a neutral stance with no clear direction.
Conclusion:
Based on the analysis of the technical indicators, the overall outlook for FSEP stock in the next few days is bullish. The trend indicators, momentum indicators, and the lack of significant volatility fluctuations support a potential upward movement in the stock price. However, the neutral volume indicators suggest a cautious approach, emphasizing the need for monitoring volume trends closely.
Recommendation:
Considering the bullish trend and momentum, investors may consider buying FSEP stock in the short term. It is essential to set appropriate stop-loss levels and closely monitor volume trends for any potential shifts in market sentiment. Additionally, staying informed about any external market factors that may impact the stock price is crucial for making well-informed investment decisions.