Technical Analysis of FSIG 2024-05-10
Overview:
In analyzing the technical indicators for FSIG over the last 5 days, we will delve into the trend, momentum, volatility, and volume indicators to provide a comprehensive outlook on the possible stock price movement in the coming days. By examining these key aspects, we aim to offer valuable insights and predictions for potential investors.
Trend Analysis:
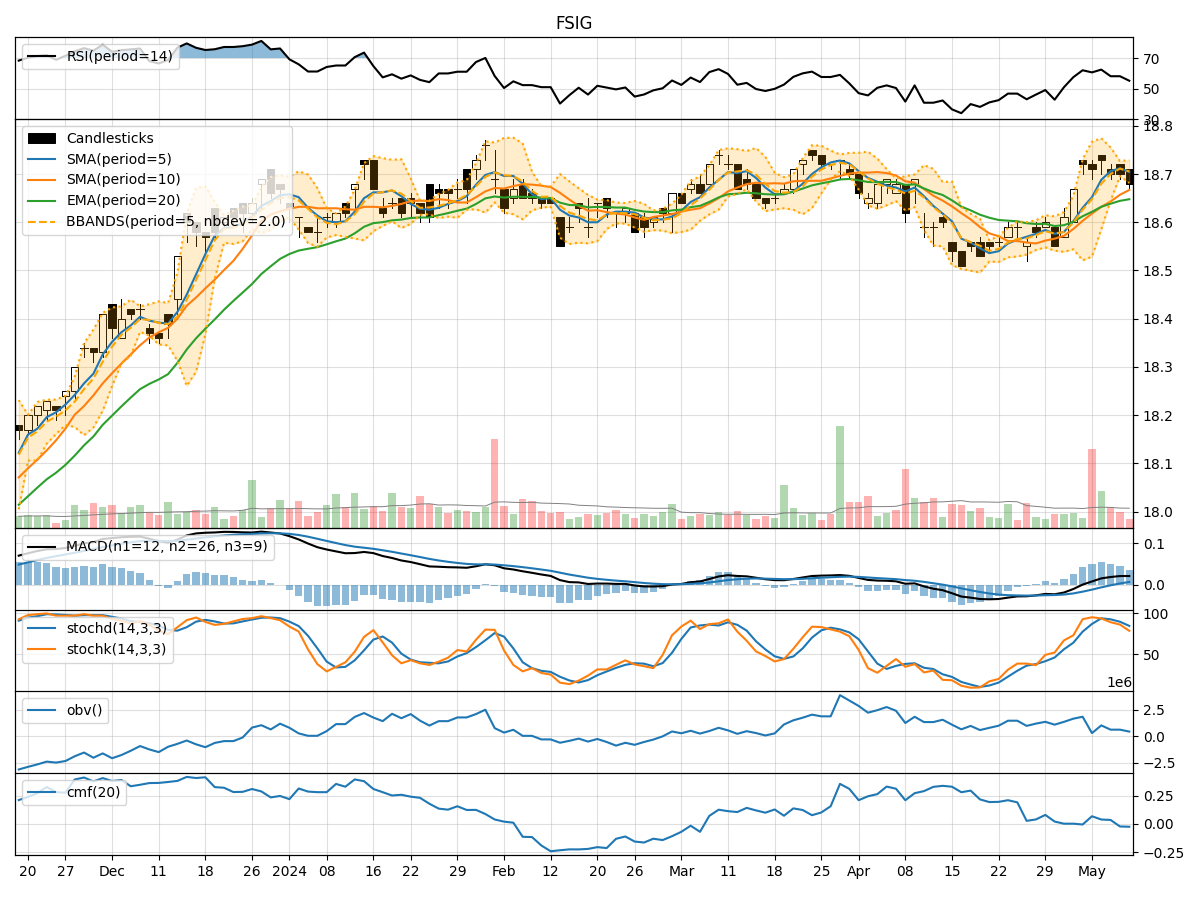
- Moving Averages (MA): The 5-day Moving Average (MA) has been relatively stable around the closing prices, indicating a consistent trend in the short term.
- MACD and Signal Line: The MACD line has been positive, showing an upward momentum in the stock price. The MACD Histogram has also been increasing, suggesting a strengthening bullish trend.
Momentum Analysis:
- RSI: The Relative Strength Index (RSI) has been fluctuating around the 50 level, indicating a balanced momentum between buying and selling pressure.
- Stochastic Oscillator: Both %K and %D have been declining, signaling a potential bearish momentum in the stock.
- Williams %R: The Williams %R is in the oversold territory, suggesting a possible reversal in the stock price.
Volatility Analysis:
- Bollinger Bands: The Bollinger Bands have been narrowing, indicating decreasing volatility in the stock price.
- Bollinger %B: The %B indicator has been hovering around the middle range, suggesting a neutral stance in terms of volatility.
Volume Analysis:
- On-Balance Volume (OBV): The OBV has been fluctuating, indicating mixed buying and selling pressure in the stock.
- Chaikin Money Flow (CMF): The CMF has been negative, suggesting a bearish outlook in terms of volume flow.
Key Observations:
- The trend indicators show a bullish sentiment with the MACD and Signal Line in positive territory.
- Momentum indicators present a mixed picture with RSI around the neutral level and Stochastic Oscillator signaling a potential bearish reversal.
- Volatility indicators suggest decreasing volatility in the stock price.
- Volume indicators indicate mixed buying and selling pressure, with a bearish outlook based on the CMF.
Conclusion:
Based on the analysis of the technical indicators, the next few days' possible stock price movement for FSIG is likely to experience a consolidation phase with a slight bearish bias. The bullish trend indicated by the MACD may face resistance due to the bearish signals from the Stochastic Oscillator and CMF. Investors should closely monitor the price action for any potential reversal patterns or breakout opportunities. It is advisable to exercise caution and wait for clearer signals before making any significant trading decisions.