Technical Analysis of FSLD 2024-05-10
Overview:
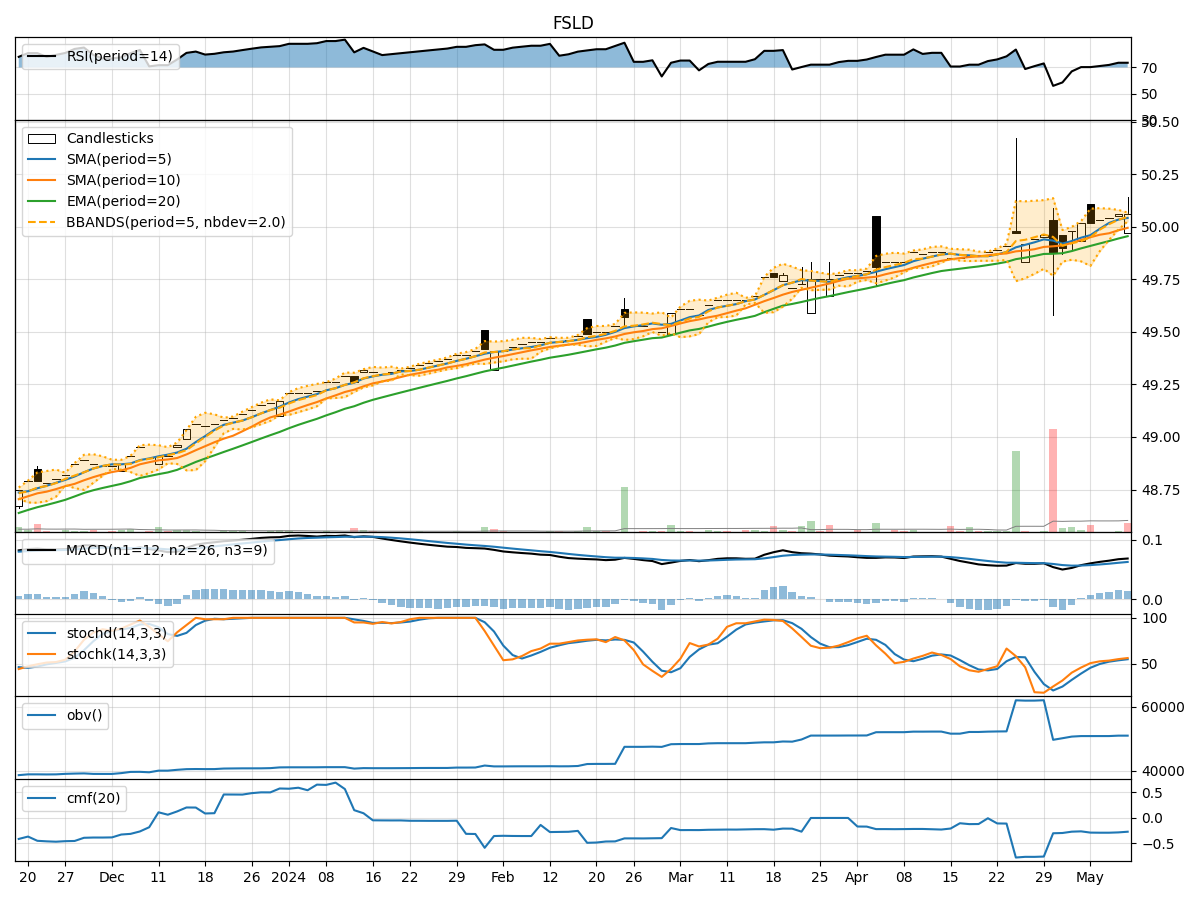
In analyzing the technical indicators for FSLD over the last 5 days, we will delve into the trends, momentum, volatility, and volume indicators to provide a comprehensive outlook on the possible stock price movement in the coming days.
Trend Indicators:
- Moving Averages (MA): The 5-day MA has been consistently above the 10-day SMA, indicating a short-term bullish trend. The EMA(20) has been steadily increasing, supporting the bullish sentiment.
- MACD: The MACD line has been above the signal line, with both lines showing an upward trend. The MACD histogram has been positive, suggesting bullish momentum.
Momentum Indicators:
- RSI: The RSI has been in the overbought territory, indicating a strong bullish momentum. However, it's important to note that sustained overbought conditions may lead to a potential reversal.
- Stochastic Oscillator: Both %K and %D lines have been trending upwards, reflecting increasing buying pressure. The stock is in the overbought zone, signaling a potential pullback.
Volatility Indicators:
- Bollinger Bands (BB): The stock price has been trading within the upper Bollinger Band, indicating an overbought condition. A breakout above the upper band may signal further upside potential.
- Bollinger %B: The %B indicator has been fluctuating around 0.7, suggesting a high volatility environment. Traders should be cautious of potential price reversals.
Volume Indicators:
- On-Balance Volume (OBV): The OBV has been relatively flat, indicating a balance between buying and selling pressure. This could suggest a period of consolidation in the stock.
- Chaikin Money Flow (CMF): The CMF has been negative, indicating a lack of buying pressure. This aligns with the flat OBV and suggests a neutral stance in terms of volume dynamics.
Conclusion:
Based on the analysis of the technical indicators, the stock of FSLD is currently exhibiting strong bullish momentum, supported by the moving averages and MACD. However, the overbought conditions indicated by the RSI and Stochastic Oscillator suggest a potential pullback or consolidation in the near term. The high volatility as per the Bollinger Bands and the neutral volume indicators further support the view of a possible correction or sideways movement.
Key Conclusion:
Given the overbought signals from the momentum indicators and the potential for a price reversal, the next few days for FSLD are likely to see a downward correction or sideways consolidation. Traders should exercise caution and consider waiting for a clearer trend before making significant trading decisions.