Technical Analysis of FSMB 2024-05-10
Overview:
In analyzing the provided Technical Analysis (TA) data for the last 5 days, we will delve into the trend, momentum, volatility, and volume indicators to forecast the possible stock price movement for the next few days. By examining these key indicators, we aim to provide a comprehensive and insightful analysis to guide investment decisions.
Trend Analysis:
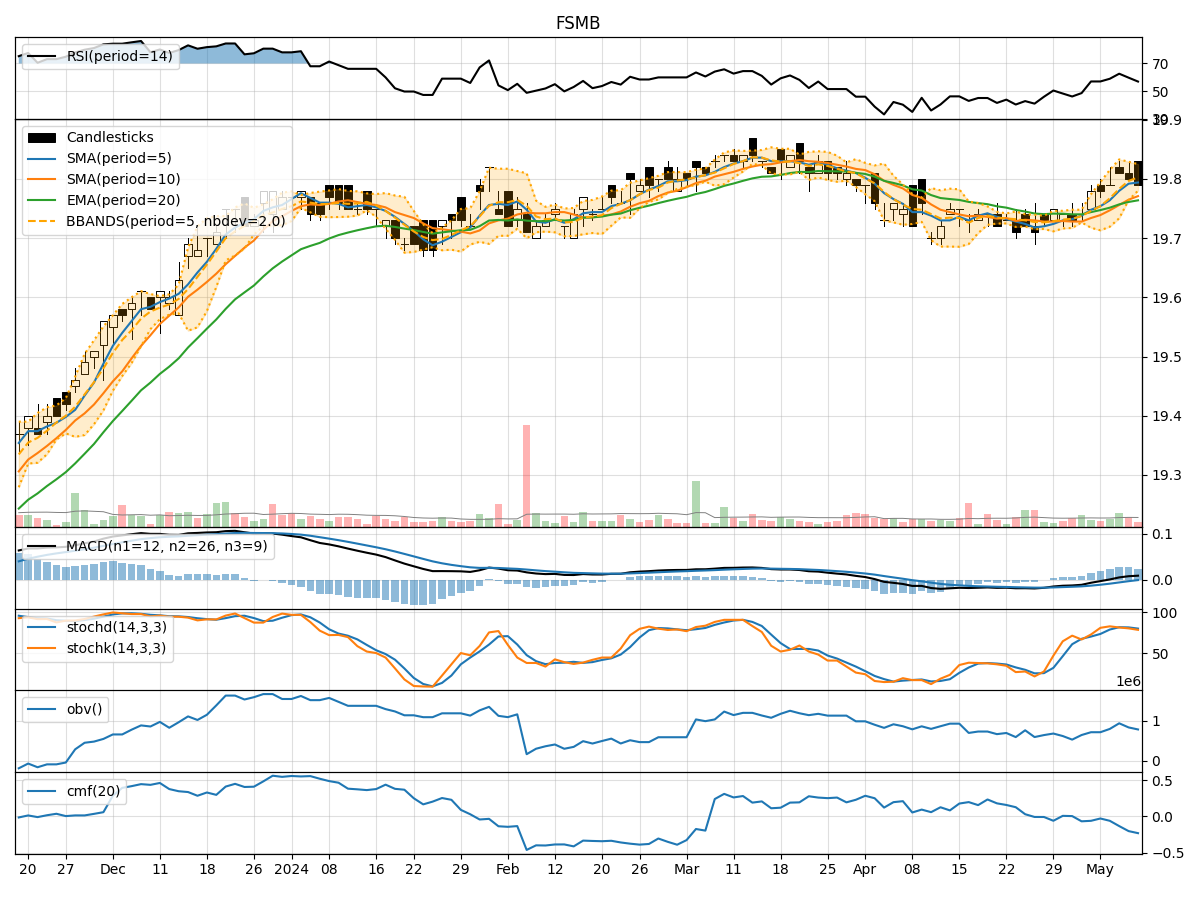
- Moving Averages (MA): The 5-day Moving Average (MA) has been consistently above the Simple Moving Average (SMA) and Exponential Moving Average (EMA), indicating a bullish trend.
- MACD: The MACD line has been consistently above the signal line, with both lines trending upwards, suggesting a bullish momentum.
Momentum Analysis:
- RSI: The Relative Strength Index (RSI) has been fluctuating around the 60-70 range, indicating a neutral momentum.
- Stochastic Oscillator: Both %K and %D have been gradually decreasing, signaling a potential bearish momentum shift.
Volatility Analysis:
- Bollinger Bands (BB): The stock price has been trading within the Bollinger Bands, with the bands narrowing, suggesting a period of low volatility.
Volume Analysis:
- On-Balance Volume (OBV): The OBV has been showing a slight decline, indicating a decrease in buying pressure.
- Chaikin Money Flow (CMF): The CMF has been negative, reflecting a bearish money flow trend.
Key Observations:
- The trend indicators suggest a bullish sentiment in the short term.
- Momentum indicators show a mixed signal with a slight bearish bias.
- Volatility is decreasing, indicating a potential consolidation phase.
- Volume indicators point towards a weakening buying pressure.
Conclusion:
Based on the analysis of the technical indicators, the next few days' possible stock price movement is likely to be sideways with a slight bearish bias. Traders should exercise caution and consider implementing risk management strategies to navigate the uncertain market conditions. It is advisable to closely monitor key support and resistance levels for potential entry and exit points.
Recommendation:
- Consider setting tight stop-loss orders to manage risk.
- Monitor key technical levels for potential breakout or breakdown scenarios.
- Stay updated on market news and events that could impact the stock price movement.
By combining technical analysis with market insights, investors can make well-informed decisions to optimize their trading strategies and achieve their financial goals.