Technical Analysis of FSMD 2024-05-10
Overview:
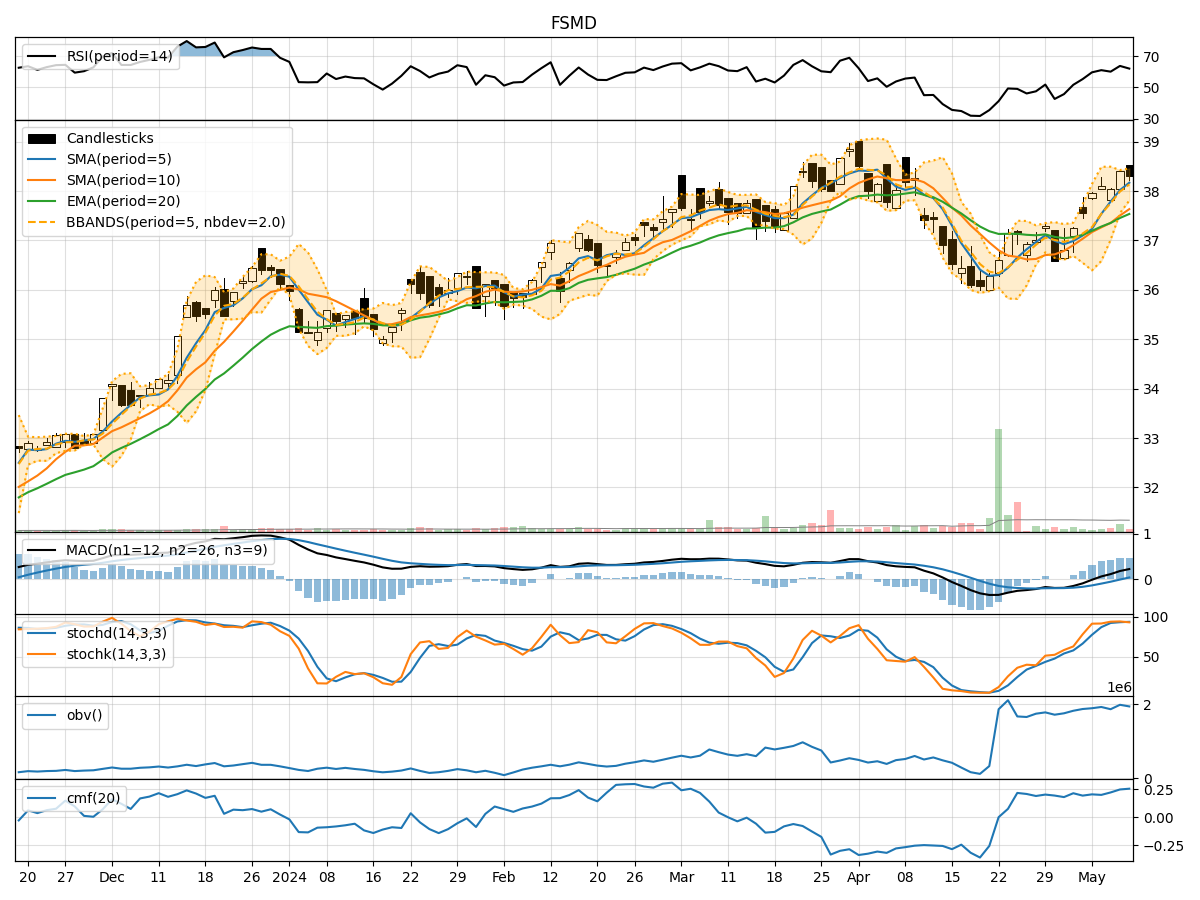
In the last 5 trading days, the stock has shown a consistent uptrend in terms of closing prices. The moving averages (MA) have been trending upwards, indicating a positive momentum. The Relative Strength Index (RSI) and Stochastic indicators suggest the stock is in overbought territory, while the Bollinger Bands show increasing volatility. The On-Balance Volume (OBV) and Chaikin Money Flow (CMF) indicators have been relatively positive, indicating buying pressure.
Trend Analysis:
- Moving Averages (MA): The 5-day MA has been consistently above the 10-day Simple Moving Average (SMA), indicating a short-term bullish trend. The Exponential Moving Average (EMA) has also been trending upwards, supporting the bullish sentiment.
- MACD: The MACD line has been above the signal line for the past 5 days, indicating a bullish trend. The MACD Histogram has been increasing, showing strengthening bullish momentum.
Momentum Analysis:
- RSI: The RSI has been in the overbought zone for the past few days, suggesting a potential reversal or consolidation in the near future.
- Stochastic Oscillator: Both %K and %D have been in the overbought region, indicating a potential pullback or consolidation.
Volatility Analysis:
- Bollinger Bands (BB): The Bollinger Bands have been widening, indicating increasing volatility in the stock price. The current price is close to the upper band, suggesting a potential reversal or correction.
Volume Analysis:
- On-Balance Volume (OBV): The OBV has been trending upwards, indicating accumulation by investors. This is a positive sign for the stock price.
- Chaikin Money Flow (CMF): The CMF has been positive, indicating strong buying pressure in the stock.
Conclusion:
Based on the technical indicators and analysis: - Trend: The stock is in a strong upward trend, supported by moving averages and MACD. - Momentum: The stock is currently overbought, suggesting a potential reversal or consolidation in the near term. - Volatility: Increasing volatility as indicated by the widening Bollinger Bands may lead to a correction or pullback. - Volume: Positive OBV and CMF indicate buying interest in the stock.
Forecast:
Given the overbought conditions, increasing volatility, and potential for a reversal in momentum, the stock is likely to experience a short-term correction or consolidation in the next few trading days. Traders should exercise caution and consider taking profits or implementing risk management strategies. Long-term investors may use any pullback as a buying opportunity, considering the overall bullish trend in the stock.