Technical Analysis of FSTA 2024-05-10
Overview:
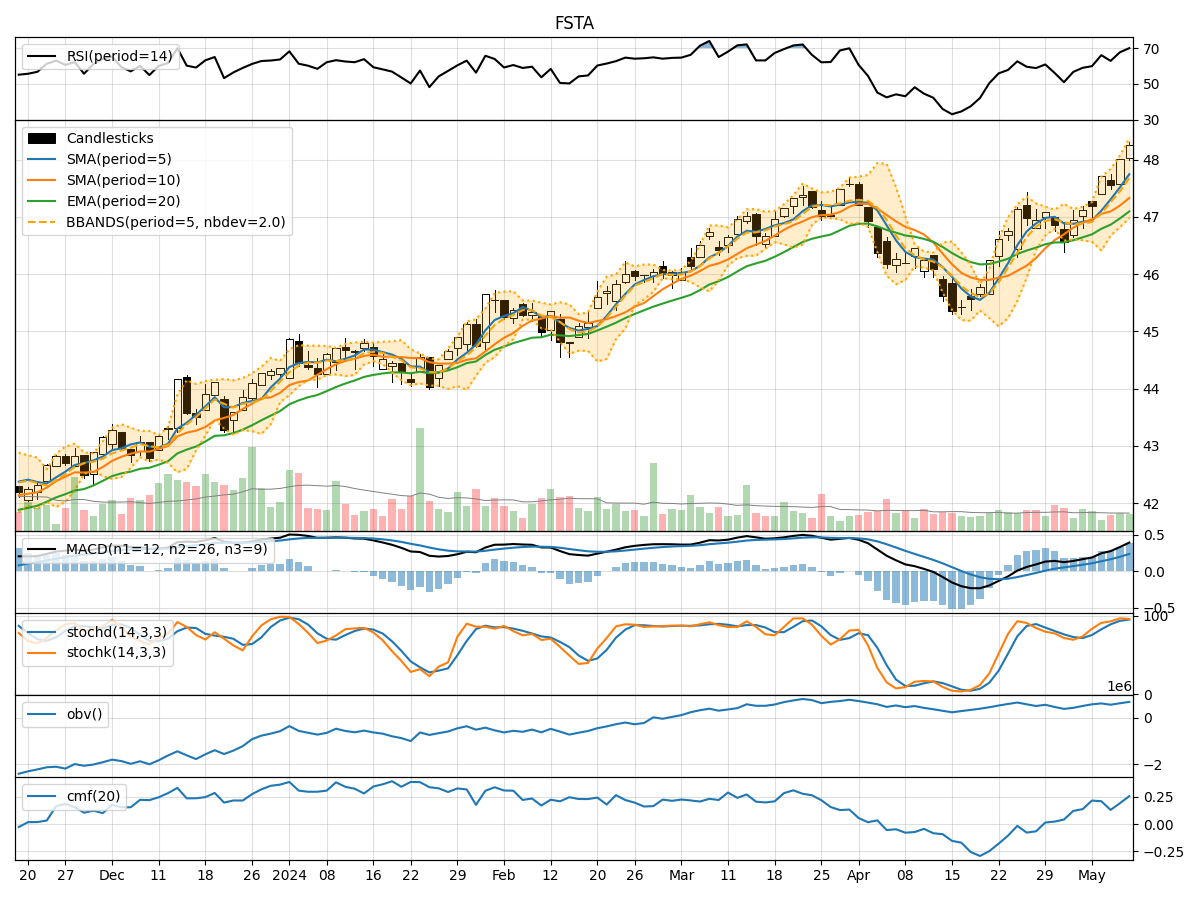
In analyzing the technical indicators for FSTA over the last 5 days, we will delve into the trend, momentum, volatility, and volume indicators to provide a comprehensive outlook on the possible stock price movement in the coming days.
Trend Analysis:
- Moving Averages (MA): The 5-day Moving Average (MA) has been consistently trending upwards, indicating a bullish momentum in the short term.
- MACD: The MACD line has been above the signal line for the past 5 days, suggesting a bullish trend.
- EMA: The Exponential Moving Average (EMA) has also been on an upward trajectory, supporting the bullish sentiment.
Momentum Analysis:
- RSI: The Relative Strength Index (RSI) has been in the overbought territory, indicating a strong bullish momentum.
- Stochastic Oscillator: Both %K and %D have been in the overbought zone, signaling a potential reversal or consolidation.
- Williams %R: The Williams %R has been fluctuating around the oversold region, suggesting a mixed sentiment.
Volatility Analysis:
- Bollinger Bands: The Bollinger Bands have been widening, indicating increased volatility in the stock price.
- Bollinger %B: The %B indicator has been fluctuating, reflecting the volatility in the price movements.
Volume Analysis:
- On-Balance Volume (OBV): The OBV has shown a positive trend, indicating accumulation by investors.
- Chaikin Money Flow (CMF): The CMF has been positive, suggesting buying pressure in the stock.
Key Observations:
- The trend indicators suggest a strong bullish sentiment in the short term.
- Momentum indicators point towards a potential overbought scenario, signaling a need for caution.
- Volatility indicators indicate increased price fluctuations, which could lead to both opportunities and risks.
- Volume indicators support the bullish trend with positive accumulation and buying pressure.
Conclusion:
Based on the analysis of the technical indicators, the stock price of FSTA is likely to experience further upward movement in the coming days. However, given the overbought signals in the momentum indicators and increased volatility, there might be a short-term consolidation or pullback before resuming the upward trend. Investors should closely monitor the price action and key support levels for potential entry or exit points.
Recommendation:
- Short-term Traders: Consider taking profits or tightening stop-loss levels to manage risk.
- Long-term Investors: Hold positions with a focus on key support levels for potential accumulation.
- New Investors: Wait for a potential pullback to enter at more favorable prices.
Always remember to combine technical analysis with fundamental research and risk management strategies for a well-rounded investment approach.