Technical Analysis of FSYD 2024-05-10
Overview:
In analyzing the technical indicators for FSYD over the last 5 days, we will delve into the trend, momentum, volatility, and volume indicators to provide a comprehensive outlook on the possible stock price movement in the coming days. By examining these key aspects, we aim to offer valuable insights and predictions for potential investors.
Trend Analysis:
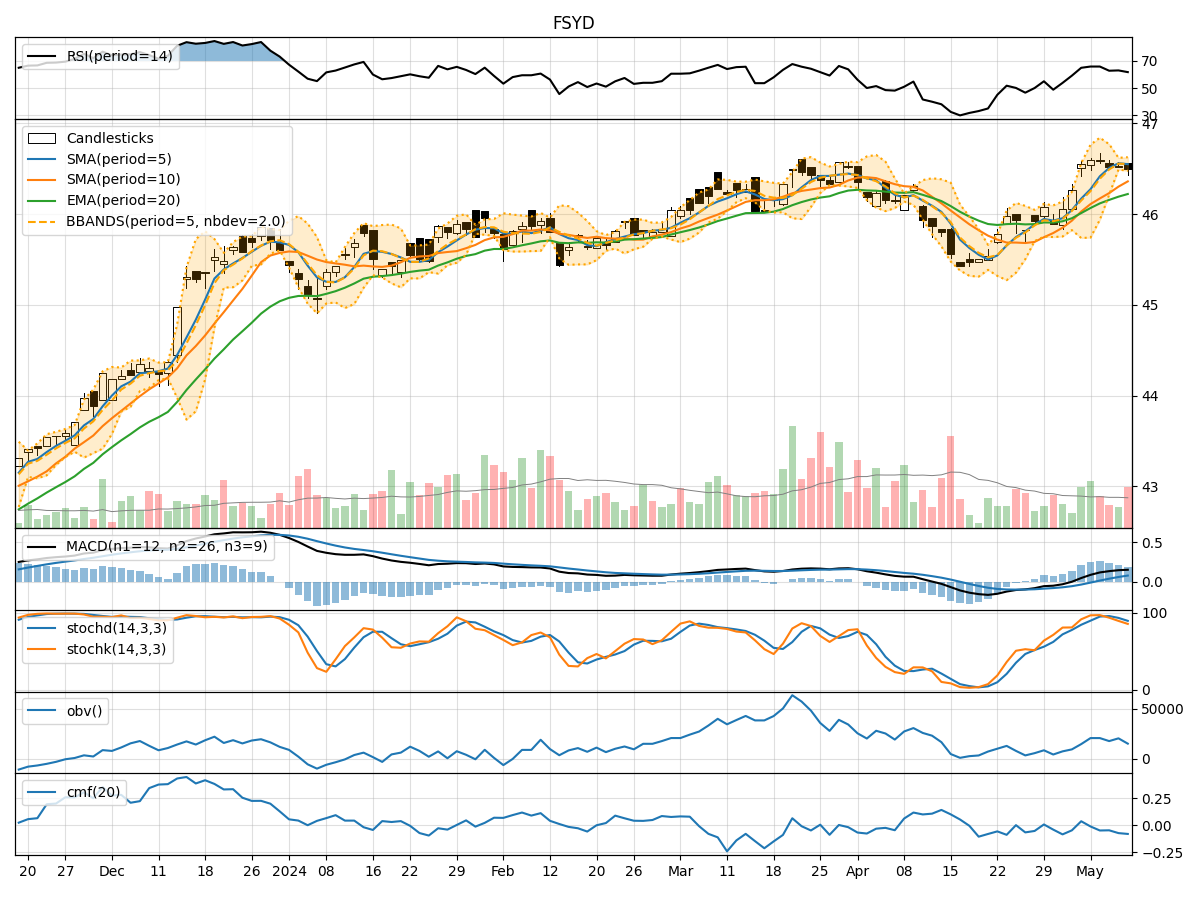
- Moving Averages (MA): The 5-day MA has been consistently above the closing prices, indicating a short-term uptrend.
- MACD: The MACD line has been positive and increasing, suggesting bullish momentum.
- EMA: The EMA has been trending upwards, supporting the bullish sentiment.
Key Observation: The trend indicators point towards a bullish outlook for FSYD.
Momentum Analysis:
- RSI: The RSI has been in the neutral zone, indicating neither overbought nor oversold conditions.
- Stochastic Oscillator: Both %K and %D have been decreasing, signaling a potential reversal.
- Williams %R: The indicator has been in the oversold territory, suggesting a possible buying opportunity.
Key Observation: Momentum indicators show a mixed signal, with a slight bearish bias.
Volatility Analysis:
- Bollinger Bands (BB): The stock price has been trading within the bands, indicating stable volatility.
- Bollinger %B: The %B is hovering around the midline, reflecting a balanced market sentiment.
Key Observation: Volatility indicators suggest a sideways movement in the stock price.
Volume Analysis:
- On-Balance Volume (OBV): The OBV has been fluctuating, showing indecision among investors.
- Chaikin Money Flow (CMF): The CMF has been negative, indicating selling pressure.
Key Observation: Volume indicators imply a bearish sentiment in the market.
Conclusion:
Based on the analysis of trend, momentum, volatility, and volume indicators, the overall outlook for FSYD in the next few days is as follows: - Trend: Upward trend based on moving averages and MACD. - Momentum: Slightly bearish due to stochastic oscillator and Williams %R. - Volatility: Sideways movement suggested by Bollinger Bands. - Volume: Bearish sentiment indicated by OBV and CMF.
Final Verdict:
Considering the mixed signals from momentum and volume indicators, alongside the bullish trend and stable volatility, it is likely that FSYD may experience consolidation in the coming days with a slight upward bias. Investors should closely monitor key support and resistance levels for potential entry or exit points.