Technical Analysis of FTAG 2024-05-10
Overview:
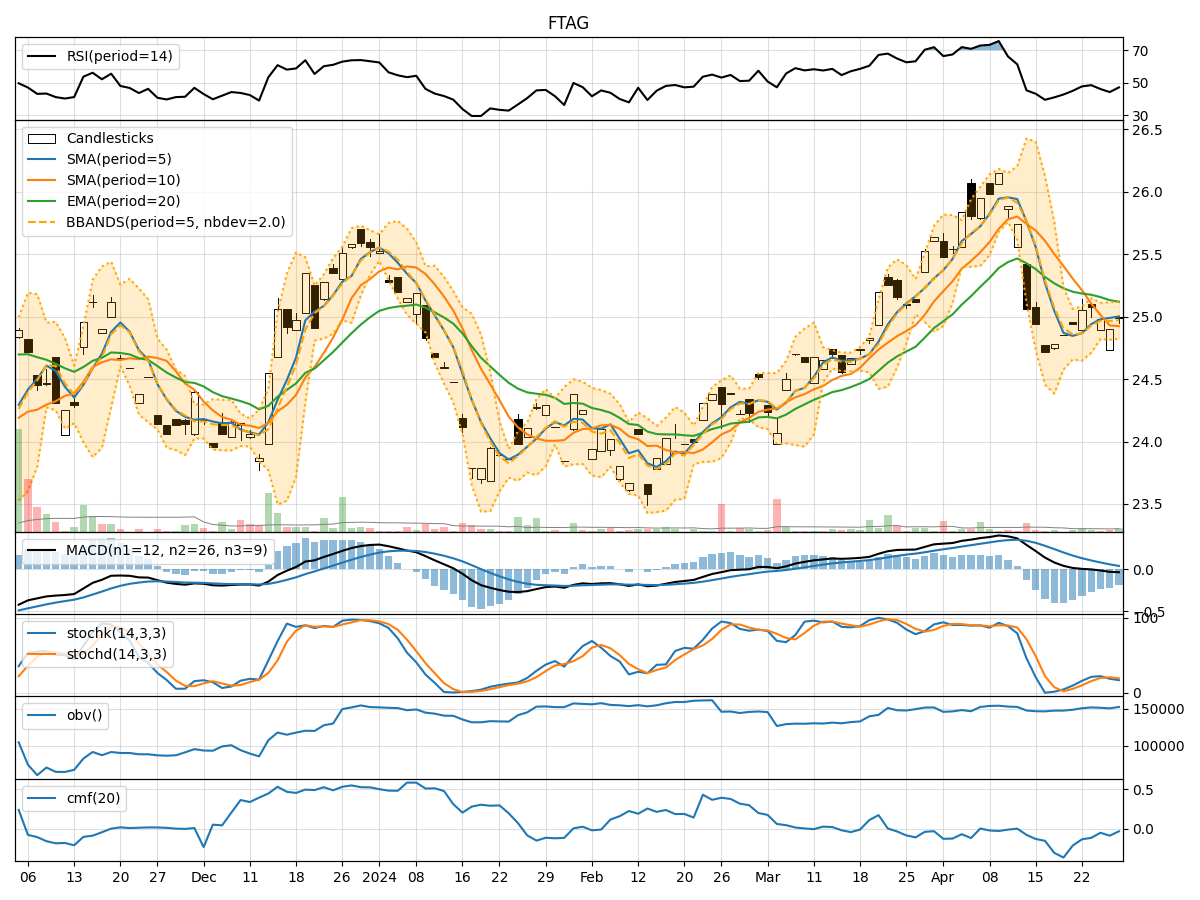
In analyzing the technical indicators for FTAG over the last 5 days, we will delve into the trend, momentum, volatility, and volume indicators to provide a comprehensive assessment of the stock's potential price movement. By examining these key factors, we aim to offer valuable insights and predictions for the next few days.
Trend Indicators:
- Moving Averages (MA): The 5-day MA has been consistently above the closing prices, indicating a short-term uptrend.
- MACD: The MACD line has been above the signal line, suggesting bullish momentum.
- EMA: The EMA has been trending upwards, supporting the bullish sentiment.
Key Observation: The trend indicators point towards a bullish outlook for FTAG.
Momentum Indicators:
- RSI: The RSI has been fluctuating around the 50 level, indicating a neutral momentum.
- Stochastic Oscillator: Both %K and %D have been oscillating within the overbought and oversold levels.
- Williams %R: The indicator has shown mixed signals, hovering around the oversold territory.
Key Observation: The momentum indicators suggest a neutral stance for FTAG.
Volatility Indicators:
- Bollinger Bands: The stock price has mostly stayed within the bands, indicating moderate volatility.
- Bollinger %B: The %B has been fluctuating around 0.5, suggesting a balanced volatility level.
Key Observation: Volatility indicators signal a stable market for FTAG.
Volume Indicators:
- On-Balance Volume (OBV): The OBV has shown mixed movements, indicating indecision among investors.
- Chaikin Money Flow (CMF): The CMF has been positive, reflecting buying pressure in the market.
Key Observation: Volume indicators imply a mixed sentiment among market participants.
Conclusion:
Based on the analysis of trend, momentum, volatility, and volume indicators, the overall outlook for FTAG in the next few days appears to be sideways with a slight bullish bias. While the trend indicators support a bullish view, the momentum and volume indicators suggest a more neutral and mixed sentiment. The stable volatility indicates a lack of significant price fluctuations.
Key Conclusion: The stock is likely to experience consolidation in the near term, with a potential for a modest upside based on the trend indicators. Investors should closely monitor key levels and wait for clearer signals before making significant trading decisions.