Technical Analysis of FTC 2024-05-10
Overview:
In analyzing the technical indicators for FTC over the last 5 days, we will delve into the trend, momentum, volatility, and volume indicators to provide a comprehensive outlook on the possible stock price movement in the coming days. By examining these key aspects, we aim to offer valuable insights and predictions to guide your investment decisions.
Trend Analysis:
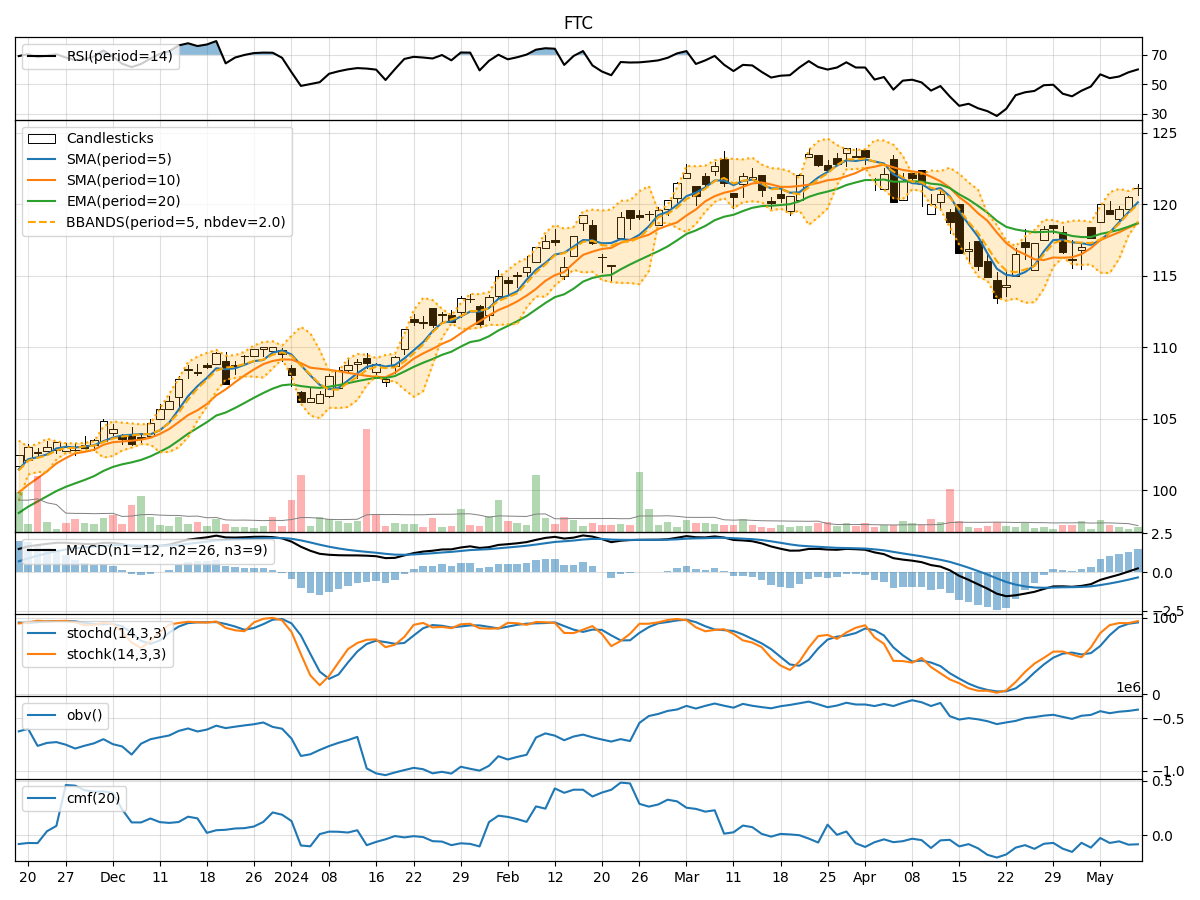
- Moving Averages (MA): The 5-day Moving Average (MA) has been consistently rising, indicating an upward trend in the stock price.
- MACD: The MACD line has been positive and increasing, suggesting bullish momentum in the short term.
- EMA: The Exponential Moving Average (EMA) has also been trending upwards, supporting the bullish sentiment in the market.
Momentum Analysis:
- RSI: The Relative Strength Index (RSI) has been increasing, showing strengthening momentum in the stock.
- Stochastic Oscillator: Both %K and %D of the Stochastic Oscillator are in the overbought region, indicating a potential reversal or consolidation.
- Williams %R: The Williams %R is in the oversold region, suggesting a possible buying opportunity.
Volatility Analysis:
- Bollinger Bands (BB): The Bollinger Bands have been narrowing, indicating decreasing volatility and a potential price breakout.
- BB %B: The %B indicator is approaching the upper band, signaling a potential overbought condition.
Volume Analysis:
- On-Balance Volume (OBV): The OBV has been increasing, reflecting accumulation by investors.
- Chaikin Money Flow (CMF): The CMF has been negative, indicating selling pressure in the stock.
Key Observations:
- The trend indicators suggest a bullish outlook with rising moving averages and positive MACD.
- Momentum indicators show mixed signals with overbought Stochastic and oversold Williams %R.
- Volatility indicators point towards a potential breakout as Bollinger Bands narrow.
- Volume indicators indicate accumulation based on OBV but selling pressure according to CMF.
Conclusion:
Based on the analysis of technical indicators, the stock is likely to experience a short-term consolidation or pullback due to the overbought Stochastic and potential overbought condition indicated by Bollinger Bands %B. However, the overall trend remains bullish, supported by moving averages and MACD. Investors should monitor the price action closely for a potential entry point during the consolidation phase before a potential continuation of the uptrend.
Recommendation:
- Short-term: Consider waiting for a pullback or consolidation before entering a long position.
- Long-term: The overall bullish trend suggests holding onto existing positions with a trailing stop-loss to capture potential gains.
By combining insights from trend, momentum, volatility, and volume indicators, investors can make informed decisions to navigate the market dynamics effectively. Remember to stay updated on market developments and adjust your strategy accordingly.