Technical Analysis of FTCB 2024-05-10
Overview:
In analyzing the technical indicators for FTCB over the last 5 days, we will delve into the trend, momentum, volatility, and volume indicators to provide a comprehensive outlook on the possible stock price movement in the coming days. By examining these key aspects, we aim to offer valuable insights and predictions for investors looking to make informed decisions.
Trend Analysis:
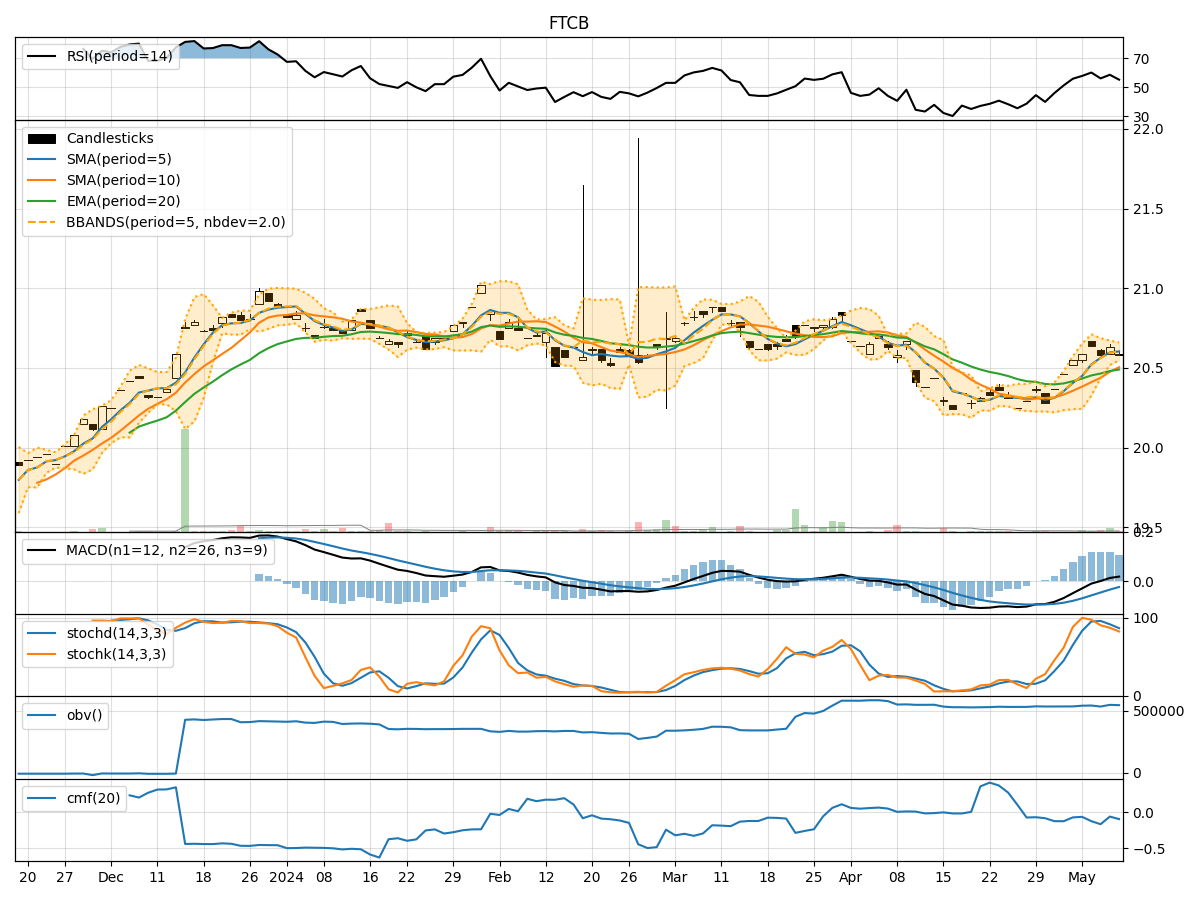
- Moving Averages (MA): The 5-day Moving Average (MA) has been consistently above the Simple Moving Average (SMA) and Exponential Moving Average (EMA), indicating a short-term uptrend.
- MACD: The MACD line has been positive, with the MACD Histogram showing an increasing trend, suggesting bullish momentum.
Key Observation: The trend indicators point towards upward momentum in the stock price.
Momentum Analysis:
- RSI: The Relative Strength Index (RSI) has been fluctuating around the 50 level, indicating a balanced momentum.
- Stochastic Oscillator: Both %K and %D have been declining, signaling a potential reversal in momentum.
Key Observation: Momentum indicators suggest a neutral to slightly bearish sentiment.
Volatility Analysis:
- Bollinger Bands (BB): The stock price has been trading within the Bollinger Bands, with the bands narrowing, indicating decreasing volatility.
Key Observation: Volatility indicators point towards stabilizing price movements.
Volume Analysis:
- On-Balance Volume (OBV): The OBV has been fluctuating, indicating indecision among investors.
- Chaikin Money Flow (CMF): The CMF has been negative, suggesting outflow of money from the stock.
Key Observation: Volume indicators reflect mixed sentiment among market participants.
Conclusion:
Based on the analysis of the technical indicators, the overall outlook for FTCB in the next few days is as follows: - Trend: The stock is likely to continue its upward momentum. - Momentum: Momentum indicators suggest a neutral to slightly bearish sentiment, potentially leading to a minor pullback. - Volatility: Volatility is expected to remain low, indicating stable price movements. - Volume: Mixed volume indicators imply indecisiveness among investors.
Final Verdict:
Considering the overall analysis, the next few days for FTCB are likely to see upward price movement with some minor fluctuations. Investors should closely monitor momentum indicators for any potential shifts in market sentiment. It is advisable to exercise caution and consider a balanced approach while making trading decisions in the current market environment.